- DOI 10.31509/2658-607x-2019-2-2-1-20
Assessment of biomass of forest species using satellite images of high spatial resolution (on the example of the forest of Khanty-Mansi autonomous okrug)
Original Russian Text © 2018 E.N. Sochilova, N.V. Surkov, D.V. Ershov, V.A. Khamedov, published in Forest Science Issues Vol. 1, No. 1, pp. 1-23
![]() © 2019 г.
© 2019 г.
E.N. Sochilova1, N.V. Surkov1, 2, D.V. Ershov1, V.A. Khamedov3
1Center for Forest Ecology and Productivity of the RAS
Profsoyuznaya st. 84/32 bldg. 14, Moscow, 117997, Russia
2 Lomonosov Moscow State University, Moscow, 119991, Russia
3 Yugra State University, Khanty-Mansiysk, 628012, Russia
E-mail: elena@ifi.rssi.ru
Received 30 October 2018
The paper describes assessment of spatial biomass of top wood layer based on combination of high-resolution Landsat-8 satellite images and selected ground forest inventory data measurements. Test area is one of forestry of Khanty-Mansiysk region. Segmentation of satellite images for spectral homogeneous land sites (segments) mapping is applied. Land category, dominated specie, age and wood stock volume for these sites are defined. Ground forest inventory data and segments used for selection of segments for dominated specie classification and validation of obtained map. The first, nine types of land cover are classified, four of them belong to forest cover with dominating of pine, spruce, cider and birch. The reference sample is updated by segments of such non-forest classes as fires, cuts and other non-forested lands, swamps, water internal bodies. Twelve spectral metrics are used for classification: reflectance in blue, green, red and near-infrared bands of Landsat-8. There are following vegetation seasons: and of winter, beginning of spring and middle of summer. The most significant informative metrics are the reflectance in the NIR band of the spring image, also green and red bands of the summer image. Random Forest algorithm is applied for training classification. The total accuracy of land categories and dominated species classification is 86,3%. Cross-validation of the classification based on the control sample was 0.712. In the second stage, we used regression models to relate the reflectance in the red band of the winter image with the taxation characteristics of the wood stock and age of the forest species in the selected reference segments. The level of relationship between the reflectance and wood stock values were equal to 0.80 for pine, 0.56 for dark coniferous species and 0.73 for birch. Between the reflectance and the specie height is following 0.75 for pine, 0.61 for birch and 0.64 for dark coniferous species. A check with control data showed that the error in estimating the wood stock above 250 m3 / ha for birch is 15.4%, for pine – 19.0% and for dark coniferous species – 5.5%. We used regional growth tables and the mean heights reconstructed from the regression equations for calculation mean specie ages. Then the age groups (according regional felling age) for each species are determined and the wood stocks are converted into wood biomass by conversion coefficients. As a result, maps of mean ages, heights, wood stock in m3/ha and biomass in t/ha were created. Based on these maps quarter assessments of the areas and stocks of the main dominated forest species of our test area, including felling age forest stands, were carried out.
Key words: stand biomass, wood stock volume, remote sensing data, Landsat-8, forest classification, Random Forest, forestry
Combining multi-season and multi-temporal images with forest inventory data allows updating the spatial information on the distribution of the main land categories and predominant tree species in the study area, as well as identification the recent changes associated with fires, loggings and other impacts on forests. This paper presents the methods and results of the spatial assessment of the top layer wood biomass using Landsat 8 satellite multi-season images of high spatial resolution and selected forest inventory data. A plot for research was selected on the territory of Sovetskoye forestry of Khanty-Mansiysk Autonomous Okrug.
Traditionally, it is believed that there are correlations between reflectance characteristics in different spectral ranges and some properties of the vegetation cover (Vinogradov, 1984; Poso et al., 1987), in particular the forest inventory characteristics of trees. Among the revealed regularities a link between the reflectance in the red spectral range and the stocks of stem wood in the study area was mentioned (Kuusela, Poso, 1970). In this paper it is also proposed to use the above-named pattern for the assessment of wood stocks and it is showed that the best results are achieved in winter, in the absence of tree leaves. Such studies were developed on a broad scale when mass inflow of similar data from Landsat satellites began in 1972 in the United States and Northern Europe. These data have been widely used to obtain tree stand characteristics such as height, projective forest cover and leaf area index (LAI) (Hall et al., 2003; Zhang et al., 2014). Many studies have focused on gaining information on green biomass volume and vegetation productivity (Hame et al., 1997; Hall et al., 2006; Ji et.al., 2012; Zhang et al., 2014). Use of optical remote sensing data for the quantification of forest fuel stocks (Arroyo et al., 2008; Gharun et al., 2017) or the volume of stem wood for logging purposes (Fazakas et al., 1999; Zheng et al. 2014) is of greater interest. Such use of this type of data is, however, much less common. Information on stands obtained from ground-based studies can be used both to construct models for remote assessment of wood stocks (Tokola, 2000; Hall et al., 2006; Chirici et al., 2008; Mura et al., 2018) and to verify the accuracy of the results (Tokola, Heikkilä, 1997; Halme, Tomppo, 2001). In Russia, more attention is paid to the use of remote sensing optical range data for the classification of forest species composition, but there are also papers on the assessment of wood stocks, for example in the southern part of the Valdai Hills (Kozlov et al., 2007) where a digital elevation model was used together with Landsat 5 and Landsat 7 data, as well as in Krasnoyarsk Krai on the basis of Landsat 7 data (Sochilova, Ershov, 2012) and in Primorsky Krai on the basis of the medium spatial resolution data of PROBA-V satellite (Zharko et al., 2018).
STUDY OBJECT AND INPUT DATA
The study area of 2.300 km2 is located within Sovetsky district of Khanty-Mansiysk Autonomous Okrug, to the east of Agirish settlement, to the north of the regional center, Sovetsky town, and to the south-east of “Malaya Sosva” nature reserve. The research area includes parts of three local forestry areas – Torskoye, Esskoye and Zelenoborskoye, which are subunits of the Sovetskoye forestry. In physical and geographical terms, the territory is located within the West Siberian Plain, on the southern spurs of the North Sosva Upland with absolute heights up to 233 m at the raising of Malososvinsky amphitheatre. Through these spurs passes the watershed between the basins of the Severnaya Sosva (flows into the Ob) and Konda (flows into the Irtysh) rivers. The lowest level of the water line is at an absolute height of 72 m. The relief of the western part of the territory is an elevated wavy morainic plain, with deeply embedded valleys of the Ess river tributaries. The eastern part is a flat fluvioglacial plain, with a much lower degree of dissection (Gvozdetsky, Mikhailov, 1978).
The climate of the studied area is continental, rather humid; in summer it is largely determined by the western cyclonic transport of Atlantic air masses, in winter – by the Asian continental anticyclone. The average temperatures in January are around minus 18 °C, in July – plus 17.5 °C. The frost-free period lasts for 90 days. Annual precipitation is up to 500 mm but due to the flat terrain and poor drainage the area is swampy (Geographical conditions…, 2018).
The study area belongs to the Severnaya-Sosva landscape province of the northern taiga forest-swampy zone of the West Siberian Plain. Forests cover 76% of the territory of the Sovetskoye forestry (Forest management regulations…, 2018). The most typical are pine green moss and shrub forests with an admixture of larch. They often have a small (8-12 m) height and a broken canopy, may turn into waterlogged open woodlands. The share of pine forests in the Sovetskoye forestry is 74%, where active logging takes place. Spruce-cedar plantations occupying less than 10% of the area are present on the drained slopes of river valleys. Flat parts of the interstream areas have a significant share of birch forests with admixed aspen and pine, often also waterlogged. In addition to forests, large areas are occupied by raised sphagnum bogs (Atlas of forests…, 1973, Gvozdetsky, Mikhailov, 1978).
Input materials are cloud-free Landsat 8/OLI scenes with a spatial resolution of 30 m obtained at different seasons: late winter (23.02.2014), beginning of spring vegetation (19.05.2016) and mid-summer (20.06.2016) (Fig. 1). We used reflectance data in blue, green, red and near infrared bands. Satellite data values are unified by converting the data into dimensionless absolute values of reflectance in the range from 0 to 1 showing the ratio between the amount of the stream of sun falling onto the object and the amount of reflected light (Markham, Barker, 1986; Belova, Ershov, 2012). The paper specially focuses on the investigation of winter reflectance in the red band to assess the stand volume through the intensity of sun beams reflected from the snow between tree crowns.
We used also selected ground-based inventory data with the information on species composition, heights, age and stocks of stem wood for each forest stand area.
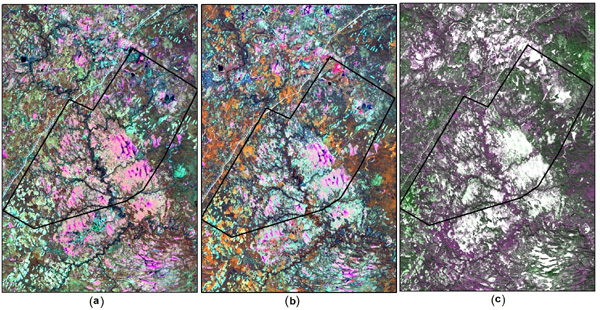
Figure 1. Spring (a), summer (b), winter (c) Landsat-8 satellite images of the test area
RESEARCH METHODS
Estimation of biomass stocks of forest species using satellite images of high spatial resolution includes following several steps:
-
segmentation of combined multiband data for the summer season into spectrally-homogeneous areas of the earth surface;
-
segment selection using inventory data to train the classifier and to assess the accuracy of classification results;
-
classification of the land cover, analysis of performance of spectral metrics and evaluation of the accuracy of the obtained map;
-
construction of regression relationships between reflectance values in the winter red band with forest-inventory characteristics (stock of stem wood and height) on selected reference segments;
-
mapping of stem wood stocks, assessment of stock estimation accuracy;
-
mapping of average heights of the stands, assessment of height determination accuracy;
-
calculation of average age of stands using tables of forest allometric equations , determination of age groups for each species;
-
conversion of wood stocks into biomass using conversion coefficients of equations.
As a result we created maps of average ages, heights, wood stock (m3/ha) and biomass (t/ha) of forest stands.
The procedure of supervised classification requires a prepared training datasets. In this case, spectrally-homogeneous segments are considered as training plots. We used Full Lambda Schedule (FLS) segmentation technique (Redding et al., 1999) for the assessment of land categories, predominant species, age and growing stock. Dominated forest specie stand plots derived from the forest inventory data with the following parameter– at least seven units in the top layer of the stand. Overlapping of segments and taxation plots makes it possible to create reference plots with the area of more than 1 hectare with one predominant species. In addition, to eliminate accidental artifacts or grave mistakes, visual expert analysis is carried out, using information about the typical conditions of certain tree species growth, as well as possible anthropogenic impacts. The reference sample of forest species is supplemented by segment plots of non-forest classes: burnt areas, clear cut areas, other non-forested areas, swamps, and water bodies.
To reach our goal, the following steps were defined: (1) classification of the land cover using all spectral metrics without exception; (2) analysis of informational value of spectral metrics and looking for their optimal number for classification; (3) evaluation of the accuracy of the results using an validation sample plots (error matrix).
Classification and analysis of performance of spectral reflectance characteristics for the classification of dominated forest species is performed using the Random Forest statistical method (Breiman, 2001). The method is based on constructing a large number of decision trees from the initial training sample. This algorithm also includes the optimal number of metrics, with which a tree divides classes most clearly, trying to ensure that each tree leaf contains observations of only one class. The resulting classification variants with different numbers of metrics are compared by the kappa coefficient (Tyurin, Makarov, 1998). The higher the value is, the more consistent the separation is. In the course of solving this task, the best consistency was achieved using seven metrics. For internal verification purposes, the entire Random Forest algorithm was executed several times, in our case – five times. The final classification version is based on a simple vote of the classifiers defined by individual trees (Chistyakov, 2013).
The Random Forest technique makes it possible to evaluate performance of the metrics using the “importance measure” of the metric for classification proposed by Breiman (Breiman, 2001). For each metric, a random forest is constructed and the probability of an OOB (Out-Of-Bag) misclassification is estimated. Then, in OOB samples, a random permutation of the metric values is performed and the probability of an erroneous classification with the modified OOB samples is estimated. The performance is estimated by averaging the difference of error probability values for all trees before and after mixing these values. Error values are standard deviation–normalized (Chistyakov, 2013). This parameter is conventionally called the “mean decrease in accuracy” (MDA). The more pixels start to leave the class defined at the beginning and mix with others, the greater MDA value will result from random mixing of the sample, which means that the metric whose values are mixed is more informative (Guyon, Elisseeff, 2003).
Using Random Forest, it is possible to assess the classification accuracy by comparing it with a set of control pixels randomly pre-selected from the original sample of reference pixels. The initial sample is divided into two equal subsets: the first is used to train the model, the second – to check the classification accuracy. The result of this analysis is a class confusion matrix showing the overall accuracy of classification.
For the analysis of performance of the metrics the classification is carried out several times with the consequent exclusion of individual spectral metrics with the lowest MDA. Each time, a confusion matrix is constructed and the number of correctly recognized pixels and the classification error of the first and second kind are estimated. Basing on the obtained errors, a diagram of classification accuracy versus the number of used metrics is constructed. This allows using the maximum value of correctly recognized pixels to determine the optimal number of informative metrics for species recognition in the study region.
As a result of the classification, a map of the land cover of the study area is created.
The next step is the construction of regression relationships between brightness values in the winter red band, with forest inventory characteristics (stock of stem wood and tree height) of the selected reference segments, to estimate the stock of wood and average age of forests (Sochilova, Ershov, 2012). The process of stocks and heights reconstruction begins with preparing of training and validation datasets, i.e. plots of stand with the dominated species and a different stock of stem wood. We used the same datasets as in the case of the land cover types classification, divided in half on training and validation subsets. If too small data are obtained, visual image analysis is used to select additional standards of a species. Then, average reflectance values for the training dataset are extracted from a Landsat 8 image scene. Equations of correlation between reflectance values of each species and forest inventory characteristics within homogeneous stand areas are then reconstructed. The estimation of the wood stock of dark coniferous species may be difficult because of the small number of pure reference stands of young trees with low stocks. A possible solution to this problem may be selection of additional support areas of deciduous stands with dark coniferous species in the second layer.
The age of stand is determined by height using regional tables of forest allometric equations and tables of stand productivity. These tables of modal stand were analyzed (Shvidenko et al., 2008; Nagimov, 2011; Sekerin, 2015; Onuchin, 2017). Tabular data and equations of correlation are compared with the actual data on the height and age of the stands of the study area. The equations that are closest to the actual ones are selected and used to further determination of the stands age. The age determined in this way allows proceeding to the age groups of forest stands. Wood biomass values for each age group of individual species are calculated using the stocks of stem wood and conversion coefficients (Zamolodchikov et al., 2003). Thematic raster maps of the stem wood stocks and biomass, heights and age are constructed.
RESULTS AND DISCUSSION
Classification of land cover. Based on the analysis of forest inventory materials, four predominant forest species forming stands of sufficient purity and area were identified: Scotch pine, spruce, Siberian pine (cedar) and birch. Stands of maple, linden and aspen presented in the test area forests less than seven units in a stand. So it was not possible to form a sample of training datasets for them. The summer Landsat 8 image (bands 2-5) was divided into homogeneous spectral segments. Overlapping between the segments and selected taxation stand areas made it possible to form reference plots for training the classifier and result monitoring. The reference sample of forest species was supplemented with segments for non-forest classes: burnt areas, clear cut areas, non-forested lands, swamps, and water bodies. As a result, the reference sample for training and validation of classification accuracy consisted of 1,811 segments for four classes of forest species and 252 segments for five non-forest classes.
At the first stage, the territory is classified into 9 types of land cover, four covered with forest classes with dominant species: pine, cedar, spruce, and birch. 12 spectral metrics are used for classification: reflectance in the blue (#2), green (#3), red (#4) and near infrared (#5) bands of the OLI Landsat 8 system for winter, spring and summer. Random Forest algorithm carried out the land cover classification based on the reference sample using all 12 metrics (Fig. 2).
Overall accuracy of forest species classification was 86.3%, error of the first kind (underestimation) – 15.1% and of the second kind (overestimation) – 12.2% (Table 1).
The largest underestimation or skipping validation pixels was seen in spruce (41%, mainly due to its confusion with cedar stands), the most significant overestimation or false classification was also observed in spruce (35%). For cedar, these values are 34 and 28%, for pine – 30 and 18%, and for birch – 8 and 7%, respectively.
Using the Breiman’s importance measure, the performance value of each metric was determined by the mean decrease in accuracy (MDA) before and after random mixing of the values of each metric in the modified sample, which makes it possible to rank the metrics by their importance. Figure 3 shows that the highest MDA with sample mixing is found for reflectance in the NIR band of the spring image, followed by the green and red bands of the summer image. The least informational value is shown by the green band in winter and spring. The evaluation of metric perfomance value was carried out based on these data, by their successive exclusion from the classification and comparison of the results with the validation sample. Initially, all 12 metrics were used for classification. The cross-validation of classification results using the validation sample gave the value of 0.712 (Fig. 4). Then, the winter green band was excluded from the analysis, which reduced the cross-validation accuracy to 0.614. Further successive exclusion of the green and blue bands (spring) and the blue band (winter) did not change the dynamics of the classification accuracy change, reducing its accuracy to 0.56 with eight metrics. Thus, all twelve spectral metrics are informative for the classification of the land cover of the study area.
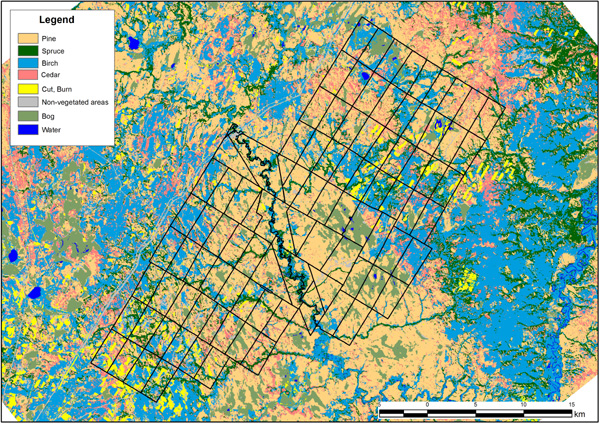
Figure 2. The land cover map of the test site
Table 1. Error matrix of land cover class recognition
|
|
Pine |
Spruce |
Cedar |
Birch |
Swamps |
Water |
Clear cut areas |
Non-forested lands |
Burnt areas |
Total number of pixels |
Number of false-classified pixels |
False classifica– tion pro– bability |
Mean |
|
Pine |
744 |
69 |
66 |
8 |
5 |
0 |
9 |
1 |
1 |
903 |
159 |
0.176 |
|
|
Spruce |
101 |
340 |
57 |
26 |
2 |
0 |
0 |
0 |
0 |
526 |
186 |
0.354 |
|
|
Cedar |
96 |
43 |
367 |
2 |
0 |
0 |
0 |
0 |
0 |
508 |
141 |
0.278 |
|
|
Birch |
8 |
21 |
1 |
501 |
2 |
2 |
3 |
0 |
0 |
538 |
37 |
0.069 |
|
|
Swamps |
5 |
3 |
0 |
0 |
522 |
1 |
1 |
0 |
0 |
532 |
10 |
0.019 |
|
|
Water |
0 |
1 |
0 |
1 |
2 |
498 |
0 |
0 |
0 |
502 |
4 |
0.008 |
|
|
Clear cut areas |
19 |
2 |
1 |
4 |
0 |
0 |
464 |
5 |
23 |
518 |
54 |
0.104 |
|
|
Non-forested lands |
0 |
0 |
0 |
0 |
0 |
0 |
1 |
305 |
2 |
308 |
3 |
0.010 |
|
|
Burnt areas |
0 |
0 |
0 |
0 |
0 |
0 |
38 |
2 |
467 |
507 |
40 |
0.079 |
|
|
Total number of pixels |
973 |
479 |
492 |
542 |
533 |
501 |
516 |
313 |
493 |
4842 |
|
||
| Number of pixels skipped |
229 |
139 |
125 |
41 |
11 |
3 |
52 |
8 |
26 |
|
634 |
|
|
| Class skipping probability |
0.308 |
0.409 |
0.341 |
0.082 |
0.021 |
0.006 |
0.112 |
0.026 |
0.06 |
|
0.151 |
||
|
Mean |
|
|
|
|
|
|
|
|
|
|
|
0.122 |
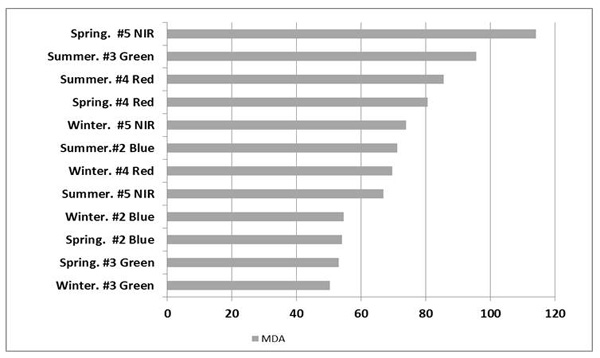
Figure 3. Assessment of performance metrics for classification of land cover
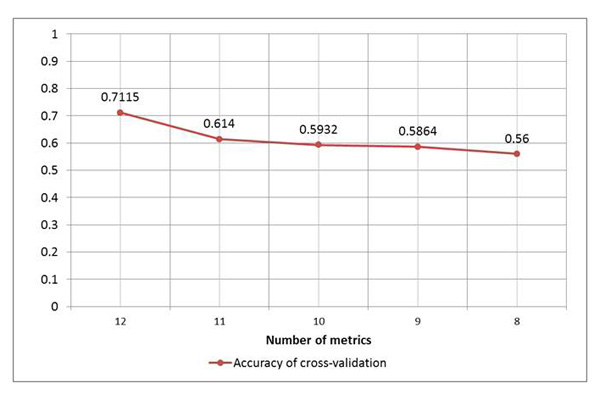
Figure 4. Change of accuracy of classes recognition depending on number of the used metrics
Determination of stem wood and biomass stocks . Test plots – segments in accordance with the inventory database for coniferous and deciduous stands – were selected in such a way as to reflect the largest range of the stocks of wood. In total, the sample included 350 plots of pine stands, 112 plots of birch and 77 plots of dark coniferous species. The latter include spruce and cedar. The area of the plots is from 1.8 to 9.5 hectares. Estimation of the stock of dark coniferous wood is difficult in terms of finding standards for young stands with low stocks. To solve this problem, additional support plots of birch stands with dark coniferous species in the second layer were selected, where the number of units of dark coniferous plants in the second layer was to be 7 or more. In the study area, the selection of 28 additional plots of this kind allowed us to increase the level of confidence of the reconstruction of dark coniferous species stocks from 0.56 to 0.63. For the training sample from the Landsat 8 winter scene, pixel spectral-reflectance brightness values are extracted and average value for each area is calculated. The obtained regression relationships between the reflectance values in the winter red band and forest inventory characteristics (stock and height) look like exponential curves (Fig. 5). The level of stocks correlation was 0.80 for pine, 0.56 for dark coniferous species and 0.73 for birch; heights correlation – 0.75 for pine, 0.64 for dark coniferous species and 0.61 for birch. The validation sample was used to assess the quality of the results. The error in determining the stocks of birch was 39.5% for small stocks (up to 50 m3/ha inclusive) and 15.4% for stocks exceeding 250 m3/ha, of pine – 50.4% (up to 50 m3/ha inclusive) and 15.5% (above 350 m3/ha), for dark coniferous species 22.2% (up to 150 m3/ha) and 2.7% (above 300 m3/ha), respectively (Fig. 6).

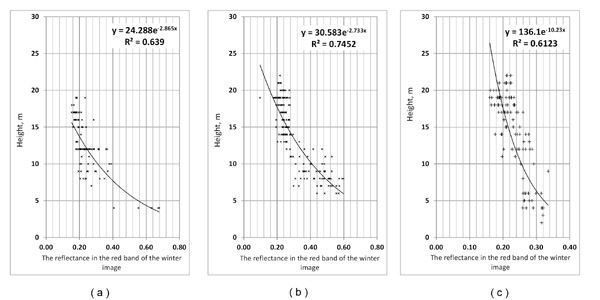
Figure 5. Relationship between the reflectance in the red band of the winter image and wood stock values (m3/ha) – top pictures; Relationship between the reflectance in the red band of the winter image and forest stand height (m) – down ones; (a) – Evergreen dark-coniferous species, (b) – Pine; (c) – Birch
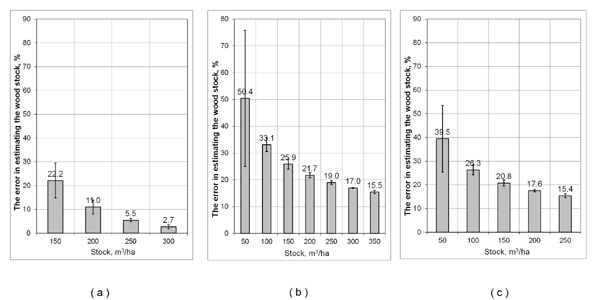
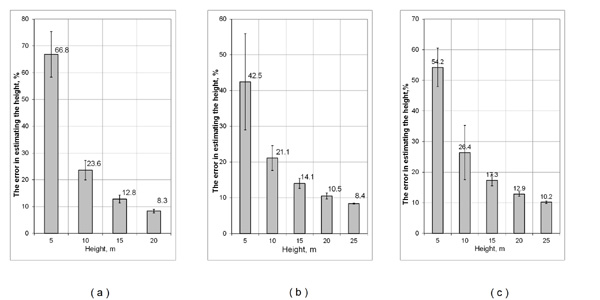
Figure 6. The error (percent) in estimating of the wood stock (top pictures) and heights (down ones) for forest species.
(a) – Evergreen dark-coniferous species, (b) – Pine; (c) – Birch
Using the coefficients of the regression equations, the reflectance values were converted into stem wood stocks and heights of pine, dark coniferous species and birch in accordance with the classification results. The result is a map of the average wood stock in m3/ha in each pixel (Fig. 7), and the heights of stands (Fig. 8).
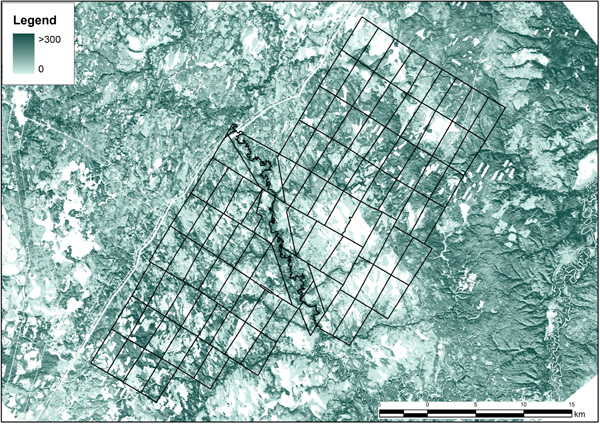
Figure 7. Map of wood stock values, m3/ha
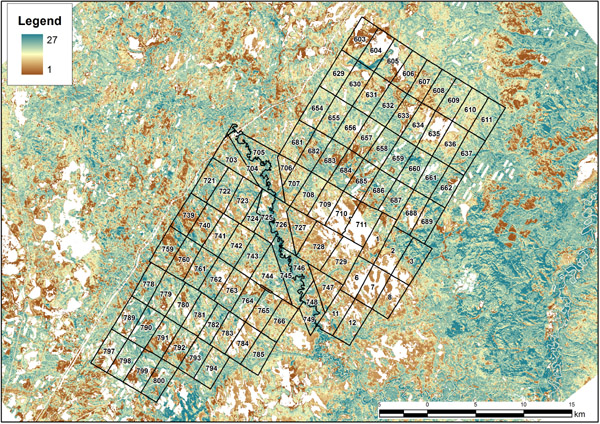
Figure 8. Map of forest heights (m)
Before determining the biomass stock, stand age was determined. Biomass is calculated by stem wood stocks and conversion coefficients determined for each tree species, latitudinal zone and age group of plants (Zamolodchikov et al., 2003). Age groups for different species are different and are accepted according to forestry regulations of the forestry of interest (Table 2). Age is determined by growth curves. The actual data best corresponded to the dependencies given in the work of A. Z. Shvidenko et al. (2008): for pine of bonitet (site index) V in the northern taiga of West Siberia, birch of bonitet IV in the middle taiga of Siberia and Siberian pine of bonitet V in the taiga of the northern and middle Urals in hydromorphic conditions. The age of plants of the respective species is calculated for each image pixel that contains the height data, and a map of plant ages of the studied area is constructed based on these three equations (Fig. 9), so as to determine age groups afterwards (Fig. 10). Stocks of wood are reconverted in biomass using conversion coefficients and the map of biomass overall stocks is created (Fig. 11) within each plant age group.
Table 2. Plant age groups according to the regulations of the Sovetskoye forestry (years)
|
Species |
Young forests |
Middle-aged |
Maturing |
Mature |
Overmature |
|
Pine |
up to 40 |
40–80 |
80–100 |
100–120 |
above 120 |
|
Spruce |
up to 40 |
40–80 |
80–100 |
100–140 |
above 140 |
|
Cedar |
up to 80 |
80–120 |
120–160 |
160–200 |
above 200 |
|
Birch |
up to 20 |
20–50 |
50–60 |
60–80 |
above 80 |
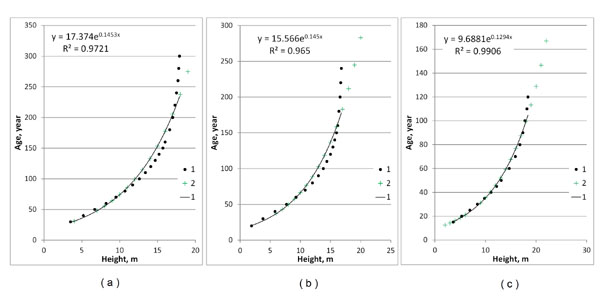
Figure 9. Relationship between ages and heights for dark-coniferous species(a), pine (b); birch (c).
It is numbered: 1 – values according to allometric tables of growth of trees and forest productivity (Shvidenko et.al., 2008), 2 – the restored values of specie ages
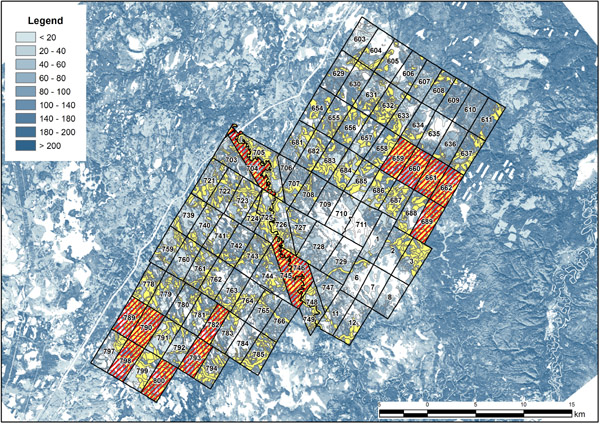
Figure 10. Maps of mean ages of forest stands, years
Forest stand and quarters polygons, in which more than 50% of the area has tree logging age are shown in yellow colour borders and in red colour hatching, consequently
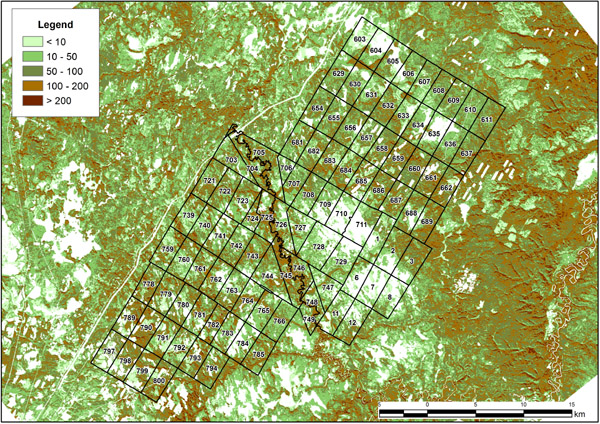
Figure 11. Map of total forest wood biomass in t/ha
CONCLUSION
The present paper has shown the possibility to estimate forest canopy biomass stocks, to determine heights and ages of stands on the basis of classification of Landsat 8 satellite multi-season images of high spatial resolution and selected forest inventory data. Our research resulted in creating thematic maps of average ages, heights, growing stocks in m3/ha and stocks of biomass in t/ha. On the basis of maps quarterly estimates of the areas and stocks of the main forest-forming species of the test area, including forest plots of the felling age, were carried out. The proposed estimates can be used as relevant information for forestry enterprises, as well as for estimation of the stocks of forest fuels in the upper canopy of the study area.
ACKNOWLEDGEMENTS
The research methods were developed in connection with the governmental assignment given to the Center for Forest Ecology and Productivity of the RAS in the line of the “Concept of satellite monitoring of the state and dynamics of forest ecosystems” (No. 0110-2018-0001), the program of the Presidium of the RAS “Development of methodological approaches to the assessment of ecosystem functions and services of forests” (No. 0110-2018-005), state assignment “Methodical approaches to the assessment of the structural organization and functioning of forest ecosystems» (No. АААА-А18-118052400130-7).
REFERENCES
Atlas lesov SSSR (The Atlas of Forests in USSR), Moscow: GUGK, 1973, 222 p.
Belova E.I., Ershov D.V., Metod predvaritel’noi obrabotki stsen Landsat-5/7 s izobrazheniem snezhnogo pokrova (The method for processing of Landsat-5/7 scenes with snow cover), Sovremennye problemy distantsionnogo zondirovaniya Zemli iz kosmosa, 2012, Vol. 9, No. 4, pp. 9-14.
Vinogradov B.V., Aerokosmicheskii monitoring ekosistem (Ecosystem monitoring from air and space), Moscow: Nauka, 1984. 320 p.
Gvozdetskii N.A., Mikhailov N.I., Fizicheskaya geografiya SSSR. Aziatskaya chast’ (Physical geography of USSR. Asian part), Moscow: Mysl’, 1978, 512 p.
URL://m-sosva.ru/? page_id=154
Zharko V.O., Bartalev S.A., Egorov V.A., Issledovanie vozmozhnostei otsenki zapasov drevesiny v lesakh Primorskogo kraya po dannym sputnikovoi sistemy Proba-V (Possibilities of timber stocks inventory using Proba-V satellite data in Primorsky Krai), Sovremennye problemy distantsionnogo zondirovaniya Zemli iz kosmosa, 2018, Vol. 15, No. 1, pp. 157-168.
Zamolodchikov D.G., Utkin A.I., Chestnykh O.V., Koeffitsienty konversii zapasov nasazhdenii v fitomassu dlya osnovnykh lesoobrazuyushchikh porod Rossii (Coefficients for conversion of timber stock to phytomass for main tree species in Russia), Lesnaya taksatsiya i lesoustroistvo,2003, Issue 1 (32), pp. 119-127.
Kozlov D.N., Puzachenko M.Yu., Fedyaeva M.V., Puzachenko Yu.G., Kartografirovanie zapasov drevostoya eli v biogeotsenozakh yuzhnoi taigi (yuzhnaya chast’ Valdaiskoi vozvyshennosti) na osnove distantsionnoi informatsii Landsat-7 i tsifrovoi modeli rel’efa. (Spruce timber stocks mapping using Landsat-7 and DEM data in the South part of Valdai upland) Aerospace methods and gis–technologies in forestry and forest management: Reports of the IV International Conference, Moscow, 17-19 April 2007, Moscow: Izdatel’stvo Moskovskogo gosudarstvennogo universiteta lesa, 2007, pp. 197-201.
Nagimov V.Z., Rost i nadzemnaya fitomassa drevostoev sosnyaka lishainikovogo v podzone severnoi taigi Tyumenskoi oblasti. Avtoreferat diss. cand. s.-kh. n. (The growth and phytomass of lichen pine forest in northern taiga forest in Tumen region. Extended abstract of candidate’s agriculture sci. thesis), Ekaterinburg: Ural’skii gosudarstvennyi lesotekhnicheskii universitet, 2011, 23 p.
Onuchin I.E., Lesovodstvenno-taksatsionnaya otsenka kedrovykh nasazhdenii na territorii Khanty-Mansiiskogo avtonomnogo okruga – Yugry. Avtoreferat diss. cand. s.-kh. n. (Forestry examination of Siberian stone pine forests in the Khanty-Mansijsk Autonomous District -YGRA. Extended abstract of candidate’s agriculture sci. thesis), Ekaterinburg: Ural’skii gosudarstvennyi lesotekhnicheskii universitet, 2017, 23 p.
Sekerin E.M., Puti povysheniya lesoobrazovatel’noi roli sosny sibirskoi v podzone yuzhnoi taigi Urala. Avtoreferat diss. cand. s.-kh. n. (Ways to raise forest-forming role of Siberian stone pine in the South Ural taiga forests. Extended abstract of candidate’s agriculture sci. thesis) Ekaterinburg, Ural’skii gosudarstvennyi lesotekhnicheskii universitet, 2015, 22 p.
URL:http://ugrales.ru/files/7-Deyat/leshoz/lhr/16032018/Sovetskoe_29_03_2018__18-np.pdf
Sochilova E.N., Ershov D.V., Analiz vozmozhnosti opredeleniya zapasov drevesnykh porod po sputnikovym dannym Landsat ETM (Possibility analysis of stem volume of forests assessment using Landsat ETM data), Sovremennye problemy distantsionnogo zondirovaniya Zemli iz kosmosa, 2012, Vol. 9, No. 3, pp. 277-282.
Tyurin Yu.N., Makarov A.A., Statisticheskii analiz dannykh na komp’yutere (Statistical analysis of data with the computer), Moscow: INFRA-M, 1998, 528 p.
Chistiakov S.P., Sluchainye lesa: Obzor (Ramdom Forests: An overview), Trudy Karel’skogo nauchnogo tsentra RAN, 2013, No. 1, pp. 117-136.
Shvidenko A.Z., Shchepashchenko D.G., Nil’sson S., Bului Yu.I., Tablitsy i modeli khoda rosta i produktivnosti nasazhdenii osnovnykh lesoobrazuyushchikh porod severnoi Evrazii (normativno-spravochnye materialy) (Tables and models of growth and productivity of forests of major forest forming species of Northern Eurasia (standard and reference materials), Moscow: Federal’noe agentstvo lesnogo khozyaistva, Mezhdunarodnyi institut prikladnogo sistemnogo analiza, 2008, 886 p.
Arroyo L.A, Pascual C., Manzanera J. A., Fire models and methods to map fuel types: The role of remote sensing, Forest Ecology and Management, 2008, No. 256, pp. 1239-1252.
Breiman L., Random forests, Machine Learning, 2001, Vol. 45, No.1, pp. 5-32.
Chirici G., Barbati A., Corona P., Marchetti M., Travaglini D., Maselli F., Bertini R., Non-parametric and parametric methods using satellite images for estimating growing stock volume in alpine and Mediterranean forest ecosystems, Remote sensing of Environment, 2008, Vol. 112, Issue 5, pp. 2686-2700.
Fazakas Z., Nilsson M., Olsson H., Regional forest biomass and wood volume estimation using satellite data and ancillary data, Agricultural and Forest Meteorology, 1999, No. 98 (1), pp. 417-425.
Gharun M., Possell M., Jenkins M.E., Poon L.F., Bell T.L., Adams M.A., Improving forest sampling strategies for assessment of fuel reduction burning, Forest Ecology and Management, 2017, Vol. 392, pp. 78-89.
Guyon I., Elisseeff A., An Introduction to Variable and Feature Selection, Journal of Machine Learning Research, 2003, Vol. 3 (1), pp. 1157-1182.
Hall R.J., Davidson D.P., Peddle D.R., Ground and remote estimation of leaf area index in Rocky Mountain forest stands, Kananaskis, Alberta, The international journal of remote sensing, 2003, No. 29, pp. 411-427.
Hall R.J., Skakun R.S., Arsenault E.J., Case B.S., Modeling forest stand structure attributes using Landsat ETM+ data: Application to mapping of aboveground biomass and stand volume, Forest Ecology and Management, 2006, No. 225, pp. 378-390.
Halme M., Tomppo E., Improving the accuracy of multisource forest inventory estimates by reducing plot location error – a multicriteria approach, Remote sensing of Environment, 2001, No. 78, pp. 321-327.
Hame T., Salli A., Andersson K., Lohi A., A new methodology for the estimation of biomass of coniferdominated boreal forest using NOAA AVHRR data, International Journal of Remote Sensing, 1997, Vol. 18, No. 15, pp. 3211-3243.
Ji L., Wylie B.K., Nossov D.R., Peterson B., Waldrop M.P., McFarland J.W., Rover J., Hollingsworthe T.N., Estimating aboveground biomass in interior Alaska with Landsat data and field measurements, International Journal of Applied Earth Observation and Geoinformation, 2012, Vol. 18, pp. 451-461.
Kuusela K. Poso S., Satellite pictures in the estimation of the growing stock over extensive area, The Photogrammetric Journal of Finland, 1970, Vol. 4, No. 1, pp. 3-9.
Markham B.L., Barker J.L., Landsat MSS and TM post-calibration dynamic ranges, exoatmospheric reflectances and at-satellite temperatures, Landsat Technical Notes, Vol.1, No. 1, 1986, P. 3-8.
Mura M., Bottalico F., Giannetti F., Bertani R., Giannini R., Mancini M., Orlandini S., Travaglinia D., Chirici G., Exploiting the capabilities of the Sentinel-2 multi spectral instrument for predicting growing stock volume in forest ecosystems, The International Journal of Applied Earth Observation and Geoinformation, 2018, No 66, pp. 126-134.
Poso S., Paananen R., Simila M., Forest inventory by compartments using satellite imagery, Silva Fennica, 1987, Vol. 2, No. 1, pp. 69-94.
Redding N.J., Crisp D.J., Tang D., Newsam G.N., An efficient algorithm for Mumford-Shah segmentation and its application to SAR imagery, Proc. Conf. «Digital Image Computing: Techniques & Applications» (DICTA-99), Perth, 1999, pp. 35-41.
Tokola T., The Influence of field sample data location on growing stock volume estimation in Landsat TM-based forest inventory in Eastern Finland, Remote sensing of environment, 2000, Vol. 74, Issue 3, pp. 422-431.
Tokola T., Heikkilä J., Improving satellite imagebased forest inventory by using a priori site quality information, Silva Fennica, 1997, No. 31 (1), pp. 67-78.
Zhang J., Huang S., Hogg E.H., Lieffers V. Qin Y., He F., Estimating spatial variation in Alberta forest biomass from a combination of forest inventory and remote sensing data, Biogeosciences, 2014, No. 11, pp. 2793-2808.
Zheng S., Cao C., Dang Y., Xiang H., Zhao J., Zhang Y., Wang X., Guo H., Retrieval of forest growing stock volume by two different methods using Landsat TM images, The international journal of remote sensing, 2014, No. 35, pp. 29-43.
Reviewer: DSc in engineering, рrofessor Lebedev Yu.V.