- DOI 10.31509/2658-607x-20214113
CARBON IN SOILS IN FOREST REGIONS OF EUROPEAN-URAL PART OF RUSSIA
![]()
O.V. Chestnykh1,2*, V.I. Grabovsky1, D.G. Zamolodchikov1
1Center for Forest Ecology and Productivity of the Russian Academy of Sciences
Profsoyuznaya st. 84/32 bldg. 14, Moscow, 117997, Russian Federation
2Lomonosov Moscow State University
Leninskie Gory 1 bldg. 12, Moscow, 119991, Russian Federation
*E-mail: ochestn@mail.ru
Received 17.02.2020
Accepted 12.03.2020
Soil carbon pool in the block of the European-Ural part of Russia was assessed on a topological basis of lands categories adopted in State Forest Inventory (21 biotopes in total). The published data on 675 soil profiles were linked to biotopes and forest regions through coordinates and descriptions of profiles (13). The total carbon stock in the soils in forest regions of the European-Ural part were 19.3*109 t C for a depth of 0–30 cm, 26.6*109 t C for a depth of 0–50 cm, and 34.2*109 t C for a depth of 0–100 cm. Forest area in the European part of Russia for these forest regions is estimated at 181.13*106 ha. Aggregated data are presented both for biotopes of the entire region and for forest regions. We compared the results obtained on top basis of dominant tree species and non-forest lands with the estimates of other authors obtained for various soil types.
Key words: forest cover lands of Russia, dominant tree species, database, forest soils, soil biocarbon stocks (Csoil), forest regions
The problem of global warming caused by anthropogenic modification of the carbon cycle of the biosphere has stimulated scientific interest in assessing carbon stocks for large territorial units: natural zones, countries, parts of continents. Since arctic, boreal, and temperate ecosystems are characterized by a significant portion of carbon in soil organic matter, territorial calculations of soil carbon stocks have become a popular area of research. For the soil cover of Russia as a whole a number of values of the total carbon pool have been calculated and published since the early 1990s (Vinson, Kolchugina, 1993; Orlov et al., 1996; Rozhkov et al., 1997; Stolbovoy, 2002, Shchepashchenko et al., 2013). A noticeable number of works contain calculations of soil carbon for regional (Titlyanova et al., 2007; Pastukhov and Kaverin, 2013), biome (Chestnykh et al., 1999, 2004; Stolbovoy, 2006), and intrazonal (Efremova et al., 1997) levels. Soil is often considered as part of ecosystem assessments of carbon pools (Alekseev, Birdsey, 1994; Utkin et al., 2001; Zamolodchikov et al., 2005, 2011; Shvidenko, Nilsson, 2002).
The procedure for obtaining areal soil carbon estimates can be divided into two parts. The first consists in the choice of the topographic basis used to obtain the values for the areas with certain contours, which presumably contain regularly homogeneous soil carbon stock. Such contours can be selected from the maps of soil types (Orlov et al., 1996, Rozhkov et al., 1997), landscapes (Chestnykh et al., 1999) and plant associations (Vinson, Kolchugina, 1993), and forest inventory records (Utkin et al., 2001; Chestnykh et al., 2004). In recent years, when choosing a topographic base, more and more attention has been paid to remote sensing products (Pastukhov, Kaverin, 2013; Shchepashchenko et al., 2013).
The second part of the procedure consists in calculating the mean values of soil carbon stocks corresponding to one or another contour. This can be done using databases generated from soil profile analyses, or using typical carbon stock values for soil categories. One of the best known databases is a digital database of typical soil profiles (Stolbovoy, McCallum, 2002). This database included 254 typical soil profiles and was used to calculate reference C stocks for soil types (Stolbovoy, 2002; 2006). The same soil profiles provided information for a later assessment of soil carbon stocks (Shchepashchenko et al., 2013), while the indicators were elaborately corrected to take into account regional variations in carbon content in various forms of soil organic matter. Nevertheless, the latest calculations of soil carbon stocks in Russia are based on a limited set of soil profiles. High variability of the soil profile even within the same soil contour (Ryzhova, 2008) and the small sample size lead to high biases in areal estimates of carbon stocks in soils.
Carbon budget in forest ecosystems is estimated based on the allocation of biotic units (elements and types of vegetation cover). Including soils in this calculation system is challenging because soil and land cover maps do not always match. Regional soil carbon stock data, aggregated by land cover type, would greatly facilitate this task.
The proposed work estimates regional soil carbon stocks presented taking into account the prevalence in the region of the habitats, in which each soil profile was produced. This approach allows obtaining refined regional estimates of carbon stocks that can be easily integrated into ecosystem estimates of the carbon budget.
MATERIALS AND METHODS
Previously, two authors of this work, using open publications, compiled a database “Soil characteristics of Northern Eurasia” (Chestnykh, Zamolodchikov, 2018). It served as the basis for calculating the carbon and nitrogen reserves in the soils of Russian forests and tundra (Chestnykh et al., 1999, 2004; Chestnykh and Zamolodchikov, 2004; Zamolodchikov et al., 2005, 2011; Utkin et al., 2001; Chestnykh et al., 1999, Zamolodchikov et al., 2017). Typical values of soil carbon were calculated using this base. We used the data on soil profile in the European-Ural part of Russia represented by three soil layers (0–30 cm, 0–50 cm, 0–100 cm). In total, we selected 675 soil profiles, containing all the data necessary for analysis: coordinates, calculated data on the carbon content in different soil layers (0–30 cm, 0–50 cm, and 0–100 cm), as well as data on the biotope, in which profiling was conducted.
Another source of data was a 2008 database of State Forest Inventory (DB SFI). It is the latest base, including descriptions of forest lands at the level of forestry enterprises[1]. The natural zones of the European-Ural part of Russia were divided into “forest regions” as main territorial units. The boundaries of these zones were determined by the order of the Ministry of Natural Resources and Environment of the Russian Federation of August 18, 2014 No. 367. Forest regions were specified here by a list of constituent entities of the Russian Federation, municipal districts, and other administrative-territorial entities. Within the framework of the projects of the Ministry of Natural Resources of the Russian Federation and the Federal Forestry Agency CEPF RAS established layers of forestry and forest regions for statistical and spatial analysis of SFI data. According to 2008 SFI data, the shares of forest areas of different categories were calculated for both forested and non-forested forest and non-forest lands (cutting, sparse forests, meadows, arable land, etc.). Using the Spatial Connection method from the ArcGIS toolkit, we obtained lists of forestries that make up forest regions. According to these lists and shares of areas, we compiled a list of the shares of lands of various categories for forest regions.
We compared land categories from SFI (for brevity, we will call them biotopes) with the descriptions of the habitats of the soil profile. There were 21 such biotopes in total.
As a source of cartographic materials we used shape files of forest regions and forestries in the European-Ural part of Russia. In total, this territory is represented by 13 forest regions and 1,239 forestry enterprises. By means of ArcGis, we calculated the total areas of the biotopes of interest to us in each forest region.
Based on the available coordinates, each soil profile was assigned a code of the forest region, in which the profile is located. Thus, the initial basis for the calculations included the fields of the forest region code, the biotope, and 3 fields with data on the carbon content in different soil layers. Based on these data, we calculated the mean specific values of carbon content in the soil for each forest region and for each biotope, and also their statistical errors.
At the next stage, the obtained specific mean values of the carbon content in the soils were multiplied by the area of the corresponding biotopes in the corresponding forest regions and, thus, we obtained the total indicators of the carbon content in the soils of the considered biotopes in the corresponding forest regions. To obtain estimates for the entire area of forest regions (FR), a conversion factor was calculated for the entire area of FR. From the sums of the areas of individual biotopes, we calculated the total areas of biotopes for each forest region:
where Si is the area of ith forest region, si,j is the area of biotope j in the forest region i, m = 21 (the total number of biotopes).
The sought coefficients are calculated as the ratio of the areas of the corresponding forest regions obtained from shapefiles ![]() to the areas obtained from the sums of biotopes composing forest regions:
to the areas obtained from the sums of biotopes composing forest regions:
In other words, this coefficient makes it possible to compensate for the area of the forest region that is missing from the sums of biotopes. This shortage is due, firstly, to the existence of lands, which cannot be attributed to forest cover lands, and, secondly, biotopes understudied in terms of soil analysis. The result of applying the conversion factor is the table of total carbon pool in the forest regions of the European-Ural part of the Russian Federation.
The calculations were conducted in the R environment and ArcGis 10.4.
This work is based on the results of processing the database for only one of the soil elements, namely, carbon. A single coefficient of 0.57 was used to recalculate humus reserves into carbon. Profile stock estimate includes both soil organic matter carbon in the upper horizons, which can be attributed to litter, and in peat horizons of bog-podzolic soils. A technique for reconstructing the patterns of vertical changes in soil density within the stratum was developed to determine the volumetric weight of soil horizons (Chestnykh, Zamolodchikov, 2004).
Thus, the total estimate for the profile includes the organic carbon reserves of the litter, organogenic, and mineral horizons.
RESULTS AND DISCUSSION
Considering the geographical variability of carbon stocks in different layers, it can be noted that for the analysis of the distribution over forest regions – in the tundra; northern, middle, and southern taiga; in the area of coniferous-deciduous forests; in the forest-steppe and steppe regions; and in the North Caucasian and Ural regions – we lack mean values for the soils of the selected categories. In particular, for larch and fir in the tundra, or for birch and aspen in the northern taiga, the data are presented by single calculations that makes it impossible to assess their variability. Moreover, for the main categories, such as sparse forest-tundra, pine, or spruce in the taiga zone, arable land, pastures, and hayfields in the steppe the total may be quite representative. Thus, in the area of coniferous-deciduous forests, the total number of soil profiles under hayfields reaches 42; the total number of soil profiles in sparse forest tundra and under arable land in the steppes reaches 38 in each zone; the total number of soil profiles in oak forests of the Caucasian region reaches 30.
Table 1 shows the distribution of typical mean carbon values in soil layers 0–100 cm, 0–50 cm, and 0–30 cm for the main categories. These data is available for all forest regions. For the 0–100 cm layer for the dominant tree species, for example, for pine and spruce, we registered an increase in the mean values of the Csoil stock from the tundra to the northern taiga, with a decrease in all more southern regions and an increase in average carbon stocks in the North Caucasus and South Ural districts. The highest values for spruce as expected are characteristic of the peat soils of the northern taiga – 211 t ha-1 and the North Ural region – 248 t ha-1; for pine, the reserves are slightly lower, against this background, the values of 784 t ha-1 are registered in the North Ural region, where the profiles are included in the profiles of peat bogs.
Table 1. Average (± SE)* stocks of carbon in the soils of different categories of forest regions in the European-Ural part of Russia
| Category | Average carbon stock, t ha-1 | Number
of profiles |
||
| Depth of profiles, cm | ||||
| 0–30 | 0–50 | 0–100 | ||
| TUNDRA | ||||
| Sparse forests | 104.5±75.30 | 133.5±110.7 | 167.4±156.3 | 60 |
| AREA OF PRE-TUNDRA FORESTS AND SPARSE TAIGA | ||||
| Pine | 62.96±48.48 | 76.69±64.17 | 96.09±81.73 | 13 |
| Spruce | 99.18±66.71 | 120.2±84.80 | 146.4±94.35 | 8 |
| Birch | 55.67±16.07 | 69.88±25.25 | 90.77±36.12 | 6 |
| Stone birch | 43.15±9.46 | 55.05±16.36 | 76.22±22.85 | 4 |
| Other soft-leaved forests | 129.2 | 209.3 | 260.4 | 1 |
| Other shrubs | 80.06 | 95.46 | 123.9 | 1 |
| Bogs | 264.4±19.71 | 448.5±79.44 | 505.1±99.64 | 8 |
| Hayfields | 91.31±36.02 | 129.3±50.34 | 175.2±47.57 | 6 |
| Sparse forests | 187.9±203.4 | 205.2±202.6 | 234.3±202.2 | 6 |
| NORTH TAIGA AREA | ||||
| Pine | 84.32±85.29 | 109.6±97.77 | 147.9±119.9 | 16 |
| Spruce | 122.8±81.91 | 161.9±116.5 | 210.5±151.1 | 18 |
| Larch | 30.28 | 45.71 | 82.91 | 1 |
| Birch | 40.34 | 51.20 | 76.54 | 1 |
| Aspen | 84.67 | 110.5 | 139.0 | 1 |
| Felling sites | 25.77±14.39 | 34.64±10.91 | 56.23±0.797 | 2 |
| Bogs | 292.8±15.52 | 471.3±80.38 | 619.5±151.4 | 4 |
| Hayfields | 66.64±18.96 | 91.34±36.96 | 137.7±84.04 | 10 |
| Sparse forests | 81.72±42.10 | 102.1±44.32 | 130.6±44.32 | 4 |
| MIDDLE TAIGA AREA | ||||
| Pine | 59.54±54.46 | 70.68±63.98 | 86.36±75.46 | 10 |
| Spruce | 43.48±29.33 | 51.63±34.07 | 67.30±39.16 | 11 |
| Fir | 13.32 | 21.84 | 37.77 | 1 |
| Birch | 138.0 | 157.9 | 176.0 | 1 |
| Aspen | 82.41 | 100.7 | 111.3 | 1 |
| Other hard-leaved forests | 57.41±25.96 | 64.49±23.67 | 74.09±16.36 | 2 |
| Other soft-leaved forests | 30.70 | 34.39 | 42.24 | 1 |
| Arable land | 45.82±30.53 | 68.54±60.83 | 122.7±142.4 | 4 |
| Bogs | 251.6±55.32 | 373.4±44.68 | 678.6±113.2 | 4 |
| Hayfields | 85.37±21.54 | 104.5±11.61 | 135.3±8.97 | 2 |
| SOUTH TAIGA AREA | ||||
| Pine | 56.01±5.85 | 63.14±0.63 | 68.73±2.51 | 2 |
| Spruce | 92.10±64.55 | 110.2±90.85 | 131.5±123.4 | 26 |
| Birch | 171.6±182.4 | 186.5±193.7 | 199.1±190.4 | 2 |
| Other hard-leaved forests | 34.21 | 41.33 | 54.51 | 1 |
| Arable land | 51.62 | 66.17 | 82.75 | 1 |
| Hayfields | 67.26±13.01 | 79.08±13.34 | 97.62±10.10 | 2 |
| AREA OF CONIFEROUS-BROAD-LEAVED FORESTS | ||||
| Pine | 43.56±30.34 | 47.05±30.76 | 55.04±28.05 | 11 |
| Spruce | 61.75±41.19 | 68.40±41.50 | 83.04±43.65 | 11 |
| Larch | 33.96±0.61 | 40.30±2.07 | 51.80±6.75 | 2 |
| Oak | 45.66±18.15 | 55.73±22.83 | 72.43±29.39 | 10 |
| Linden | 50.62±19.09 | 65.43±30.45 | 101.0±72.60 | 6 |
| Birch | 40.21±33.11 | 48.59±34.83 | 61.89±40.04 | 7 |
| Aspen | 31.62 | 36.74 | 53.67 | 1 |
| Other hard-leaved forests | 21.64±0.74 | 28.08±3.17 | 41.16±8.86 | 2 |
| Other soft-leaved forests | 38.77±21.50 | 47.45±30.46 | 58.49±38.14 | 10 |
| Felling sites | 24.05 | 34.82 | 57.36 | 1 |
| Arable land | 38.93±23.03 | 56.96±37.96 | 97.45±73.86 | 16 |
| Hayfields | 61.76±29.09 | 85.71±47.02 | 108.6±61.01 | 42 |
| FOREST STEPPE AREA | ||||
| Pine | 18.78±16.42 | 29.59±15.07 | 47.18±14.26 | 2 |
| Spruce | 110.5±34.01 | 119.1±36.14 | 136.4±43.56 | 8 |
| Oak | 27.70 | 36.49 | 57.06 | 1 |
| Birch | 127.3±117.0 | 172.6±183.0 | 212.3±235.5 | 5 |
| Aspen | 54.82±30.93 | 61.29±26.74 | 71.97±19.45 | 2 |
| Arable land | 111.2±33.57 | 164.9±59.07 | 201.6±67.66 | 5 |
| Hayfields | 108.4±4.48 | 167.2±6.12 | 243.6±10.49 | 3 |
| STEPPE AREA | ||||
| Pine | 26.56±19.00 | 36.60±20.92 | 55.49±34.51 | 2 |
| Spruce | 78.12±55.26 | 99.97±69.94 | 139.8±93.25 | 4 |
| Oak | 20.54±6.658 | 28.51±9.280 | 46.68±10.76 | 2 |
| Hornbeam | 30.37 | 37.67 | 50.13 | 1 |
| Beech | 52.06±19.30 | 71.69±30.48 | 106.3±46.17 | 9 |
| Birch | 15.36 | 20.65 | 34.62 | 1 |
| Other soft-leaved forests | 84.90±38.15 | 116.5±53.60 | 162.0±70.38 | 4 |
| Other hard-leaved forests | 46.83±1.861 | 67.40±2.811 | 101.3±18.54 | 2 |
| Arable land | 63.27±22.72 | 95.75±32.56 | 148.4±52.22 | 38 |
| Pastures | 75.59±30.11 | 103.8±36.44 | 148.8±44.88 | 35 |
| Hayfields | 65.76±30.89 | 93.41±41.93 | 137.3±61.69 | 26 |
| NORTH CAUCASIAN MOUNTAIN AREA | ||||
| Pine | 81.82±33.69 | 109.1±43.00 | 151.6±60.99 | 9 |
| Spruce | 128.5±45.87 | 168.9±50.73 | 200.0±42.66 | 6 |
| Fir | 77.45±52.07 | 100.0±66.49 | 129.3±71.20 | 11 |
| Oak | 48.26±18.94 | 64.70±24.80 | 91.25±32.11 | 30 |
| Hornbeam | 54.16±31.22 | 72.52±40.32 | 105.7±53.70 | 12 |
| Beech | 59.95±27.60 | 79.00±38.23 | 114.0±48.47 | 15 |
| Linden | 88.57 | 103.0 | 131.5 | 1 |
| Birch | 84.47±50.42 | 103.6±55.82 | 133.2±56.49 | 6 |
| Maple | 91.78 | 124.7 | 158.0 | 1 |
| Steppe | 76.29 | 115.9 | 178.3 | 1 |
| Arable land | 104.6±20.43 | 150.9±31.16 | 217.2±38.37 | 7 |
| Pastures | 80.21±15.13 | 117.8±25.11 | 164.4±34.76 | 10 |
| Hayfields | 91.44±20.66 | 128.6±28.75 | 182.9±45.09 | 7 |
| Gardens | 160.8 | 217.2 | 279.5 | 1 |
| NORTH-URAL AREA | ||||
| Pine | 307.1 | 537.6 | 783.6 | 1 |
| Spruce | 145.5±87.25 | 191.7±98.27 | 248.2±125.3 | 4 |
| Hayfields | 101.7±26.64 | 147.0±28.25 | 178.8±32.81 | 2 |
| Sparse forests | 37.92±26.57 | 48.33±29.54 | 70.27±35.09 | 8 |
| Bogs | 77.35±0.755 | 112.4±22.57 | 140.9±22.57 | 2 |
| MIDDLE URAL AREA | ||||
| Pine | 47.08±17.58 | 55.85±21.76 | 77.22±33.52 | 5 |
| Spruce | 63.46±34.05 | 81.98±45.32 | 111.9±63.76 | 11 |
| Larch | 148.1 | 167.6 | 199.0 | 1 |
| Birch | 63.95±16.24 | 76.14±14.96 | 93.74±10.89 | 3 |
| SOUTH URAL AREA | ||||
| Pine | 72.44±0.20 | 85.42±8.73 | 106.4±19.29 | 2 |
| Spruce | 89.89 | 100.9 | 126.4 | 1 |
| Birch | 53.17±6.38 | 63.69±8.34 | 81.31±17.21 | 3 |
| Other soft-leaved forests | 128.5 | 158.3 | 190.3 | 1 |
| Hayfields | 114.7±12.13 | 137.4±14.22 | 165.9±14.22 | 2 |
| Sparse forests | 135.7±11.93 | 157.5±2.750 | 190.1±8.561 | 2 |
Note:*SE –standard error
It is interesting to compare the data obtained with the data of the authors (Chestnykh, Zamolodchikov, 2017), which were calculated for the European-Ural region of Russia, while a different calculation methods were used, when the data were distributed to latitudinal bands, thus, the entire territory of the European-Ural part was covered by three belts (northern, middle, and southern subzones of the taiga), for which we calculated the stocks of soil carbon under the dominant tree species. Despite the different calculation algorithms, the data on the average carbon content in the 0–100 cm layer are in good agreement. Thus, the magnitude of the absolute values of the differences in estimates for pine and spruce from the regions of the northern, middle, and southern subzones of the taiga and the data most relevant to these regions calculated by the methods of O.V. Chestnykh and D.G. Zamolodchikova (2017) averages 24% (14÷45). In the calculations taken for comparison, the mean values under the dominant tree species were calculated from the entire data array falling into the selected belt. In this work, these estimates are more detailed, since the profiles were distributed over biotopes, and the following calculations took into account the contribution of each biotope. Thus, we present weighted mean values for each forest region, not simple regional mean values.
For bogs, we register a natural increase in average stocks from the area of pre-tundra forests to the middle taiga area – from 505 t ha-1 to 679 t ha-1. For biotopes not covered by forests, for example, for arable lands and hayfields, the carbon content in the 0–100 cm layer reaches its maximum values in the southern regions: the forest-steppe forest area (202 t ha-1 and 244 t ha-1) and the North Caucasian forest region (217 t ha-1 and 183 t ha-1 for arable land and hayfields, respectively).
The samples used in Table 1 for the analysis of the geographical variability of Csoil, for a number of biotopes, show high variability. Even in the cases of the largest samples (25–50 soil profiles), the relative error of Csoil values ranges from 6% to 50%. Obviously, this is the result of inclusion of several soil types in the same biotope. For example, for the biotope of sparse forest-tundra in the area of pre-tundra forests, the relative error reaches 86%. The value is calculated based on 6 indicators for the Kola Peninsula, which describe 2 profiles of podzolic soils with mean values of 81 t ha-1and 90 t ha-1, 3 profiles with soddy soils with mean values of 83 t ha-1, 93 t ha-1, and 246 t ha-1and the last profile of 6 – in peaty soils with a mean value of 600 t ha-1.
Comparing the obtained mean values of soil carbon stocks with the estimates of other authors, we noted the following: the work of D.G. Shchepashchenko et al gives the data on the average reserves in the 0–100 cm layer for Russia; calculations are made using a soil map and a base of typical soil profiles (49 profiles), using a number of correction factors (Shchepashchenko et al., 2013). The estimates of the meter layer for the European part of Russia are in a good agreement. Although it is quite difficult to compare these data since this work does not contain any estimates for the soil carbon stocks under the dominant tree species, but only a general concept – forest. Nevertheless, in this category, the authors cite the average reserves for the northern taiga – 19.68 kg C m-2 whereas our estimates are somewhat lower – from 9.1 kg C m-2 under birch stands to 14.1 kg C m-2 under spruce stands. A good coincidence is observed for northern bogs – the authors’ estimates of 40 kg C m-2 coincide with ours – 50 kg C m-2.
For the forest category in the southern taiga, the authors give the figure of 14.6 kg C m-2, which is covered by the range of the values we obtained: from 13.1 kg C m-2 for spruce stands to 19.9 kg C m-2 for birch stands; almost perfect coincidence is observed for the bogs in the southern taiga – 9.93 kg C m-2 according to data from the work of D.G. Shchepachenko et al. (2013) and 9.76 kg C m-2 according to our data. Our estimates of the average stocks of soil carbon are close to those given in this work, except for a number of cases with somewhat lower values.
The work of A.V. Pastukhov and D.A. Kaverin (2013) gives the data on the content of soil carbon in the main soil groups for the southern tundra and middle taiga of the Murmansk region for 0–30 cm and 0–100 cm soil layers. For the tundra, the estimates of soil carbon reserves in the 0–30 cm layer given by the authors are close to ours: 10.8 kg C m-2 versus 10.5 kg C m-2, respectively. Not so complete agreement of the estimates is observed in the layer 0–100 cm – 28.7 kg C m-2 versus 16.7 kg C m-2 (our data), respectively. For the middle taiga, the authors give the figure of 8.2 kg C m-2for 0–30 cm layer; for the 0–100 layer, this indicator is equal to 16.1 kg C m-2, whereas our data are 9.2 kg C m-2 and 15.5 kg C m-2, respectively. In general, the differences in estimates do not exceed the range of errors of the means.
Table 2 shows the total soil carbon stocks for forest regions as a whole.
Table 2. Stocks (± SE)* of carbon in the soil layers of forest regions for the European-Ural part of Russia
| Region | Area of 106 ha | Carbon stock of 109 t С | Number of profiles | ||
| Depth of profiles, cm | |||||
| 0–30 | 0–50 | 0–100 | |||
| Tundra | 0.24 | 0.026±0.018 | 0.033±0.027 | 0.041±0.038 | 60 |
| Area of tundra forests and sparse taiga | 23.38 | 3.47±0.98 | 5.29±1.71 | 6.12±2.04 | 53 |
| North taiga area | 35.09 | 4.94±2.01 | 7.20±3.07 | 9.53±4.30 | 57 |
| Middle taiga area | 31.91 | 2.92±0.93 | 3.62±1.03 | 4.93±1.37 | 37 |
| South taiga area | 17.79 | 2.09±1.80 | 2.33±2.1.99 | 2.57±2.13 | 34 |
| Coniferous-deciduous forest area | 23.01 | 1.02.±0.67 | 1.18±0.71 | 1.48±0.78 | 119 |
| Forest-steppe area | 4.98 | 0.27±0.18 | 0.36±.25 | 0.47±0.29 | 26 |
| Steppe area | 2.51 | 0.10±0.03 | 0.13±0.05 | 0.20±0.07 | 124 |
| North Caucasian mountain area | 2.23 | 0.14±0.06 | 0.18±0.08 | 0.25±0.10 | 117 |
| North Ural area | 12.46 | 2.54±0.38 | 4.12±0.49 | 5.81±0.61 | 17 |
| Central Ural area | 19.69 | 1.24±0.42 | 1.51±0.51 | 1.97±0.65 | 20 |
| South Ural area | 7.83 | 0.54±0.02 | 0.64±0.06 | 0.80±0.12 | 11 |
| Total | 181.13 | 19.30±7.5 | 26.60±9.95 | 34.17±12.51 | 675 |
Note:*SE – standard error
The mean values of carbon reserves obtained by us for a depth of 0–50 cm are close to the data obtained by E.A. Vaganov et al. for the soils of forest ecosystems of the Yenisey meridian (Vaganov et al., 2005). Thus, for forest tundra, the authors’ indicator is 103 t ha-1, whereas according to our data for tundra and sparse taiga these indicators should be 134 t ha-1and 226 t ha-1, respectively. For the northern taiga, the authors give an estimate of 118 t ha-1, while according to our results this indicator should be 205 t ha-1; for the middle taiga, the authors give an estimate of 107 t ha-1, while according to our results this indicator should be 114 t ha-1; for the southern taiga, the authors give an estimate of 134 t ha-1, while according to our results this indicator should be 131 t ha-1. In more northern areas, we registered greater differences in estimates, since the percentage of wetlands increasing the total reserves differs for the Siberian and European parts of the country.
The highest mean value of 466 t ha-1 is characteristic of the soils in the North Ural and north taiga; 272 t ha-1 is characteristic of the regions, where wetlands are taken into account. The minimum mean values of 64 t ha-1 were calculated for the coniferous-deciduous region and 80 t ha-1 for the steppe area, which is possibly due to either the aridity of the territories, or the plowing of the steppes, and the inclusion of areas with large mean values into the biotope “arable land”.
Total soil carbon stocks of the forest regions in the European-Ural part was 19.3*109 C t for a depth of 0–30 cm, 26.6*109 C t for a depth of 0–50, and 34.2*109 C t for a depth of 0–100 cm. The total area of forest lands in the European part of Russia for these forest cover lands is estimated at 181.13*106 ha. The maximum reserves are characteristic of the north taiga area, the minimum reserves are characteristic of the steppe area and the North Caucasian mountain area that reflects, on the one hand, the distribution of the areas of the corresponding plots, on the other hand, can be explained by the large amount of peat lands in the northern areas. The reserves of carbon in the soils of the tundra zone were estimated at 26*106 C t for a depth of 0–30 cm, 33*106 C t for a depth of 0–50 cm, and 41*106 C t a depth of 0–100 cm.
Our results are incomparable with the data of other authors since our estimation approach is oriented towards the problem of estimating the carbon budget, its pools and fluxes in forest regions. At the same time, most of the estimates of soil C stocks are calculated using soil maps and can be compared with them only on the basis of data integrated at the regional level. Estimates of soil C stocks under dominant tree species and non-forest land categories are much less common than estimates of soil C stocks for different soil types. In the 0–100 cm layer, we register the convergence of the final Сsoil estimates of different authors.
The work of D.V. Orlova et al. describes the reserves of organic carbon in soils and peats: for a meter thickness in the European part as a whole, they are 41.9*109 C t (Orlov et al., 1996), whereas our calculations fit into the range of 34.2±12.5* 109 C t of errors of the means.
When comparing our data with those of O.V. Chestnykh and D.G. Zamolodchikov (Chestnykh, Zamolodchikov, 2017), the other principles of calculation of which were mentioned above, we registered a good coincidence of both the data on the area of forest regions in the European part – 178.8*106 ha and 181.13*106 ha (this work), and of the data on the final stocks for different depths –18.1*109 C t and 19.3*109 C t (this work) for a depth of 0–30 cm, 25.1*109 and 26.6*109 C t for a depth of 0–50 cm, 34.7*109 C t and 34.2*109 C t for a depth of 0–100 cm. Obviously, the reason for the differences in data is the result of analyzing soil data in terms of the representativeness of biotopes in the corresponding forest regions, while the work, with the results of which we compare our results, contains only the calculations of simple means of soil profiles by geographic bands.
The total reserves in the entire territory of the European-Ural part of Russia were estimated at 34.2±12.5*109 C t for 0–100 cm depth, including the tundra region.
The gross reserves of Csoil in forest regions are hardly comparable, since they depend on the total areas of forest cover lands. Soil-carbon capacity (in t C ha-1) of lands of different categories is more indicative in this case. Since these indices differ not so significantly for soils in forested and unforested lands (Table 3), it is advisable to analyze only the contribution of non-forest lands and lands covered with forest vegetation.
Table 3 shows the mean reserves of different categories of forest lands, calculated for the entire territory of the European-Ural part as a whole, without dividing them into forest regions. The smallest average stocks are typical for felling sites; higher average stocks are typical for pastures, hayfields and larch forests, whereas the highest average stocks are typical for bogs.
Table 3. Average (±SE)* carbon stocks in soil of different categories for the entire European-Ural part of Russia
| Category | Average carbon stock, t ha-1 | Number
of profiles |
||
| Depth of profiles, cm | ||||
| 0–30 | 0–50 | 0–100 | ||
| Pine | 85.47±40.76 | 119.56±47.22 | 121.84±50.6 | 73 |
| Spruce | 88.04±56.61 | 110.32±73.3 | 140.51±90.99 | 108 |
| Fir | 74.2±49.43 | 96.13±63.12 | 124.66±67.59 | 12 |
| Larch | 136.5±0.02 | 155.25±0.06 | 186.49±0.21 | 4 |
| Oak | 34.24±9.71 | 44.9±12.67 | 65.56±16.06 | 43 |
| Hornbeam | 48.41±23.66 | 64.08±30.56 | 92.25±40.69 | 13 |
| Beech | 58.24±25.8 | 77.41±36.55 | 112.36±47.98 | 24 |
| Linden | 51.52±18.71 | 66.53±30.11 | 102.02±71.39 | 8 |
| Birch | 90.3±44.29 | 104.34±48.43 | 121.84±50.6 | 39 |
| Aspen | 55.34±5.61 | 65.95±4.85 | 79.71±3.53 | 5 |
| Other hard-leafed forests | 43.46±1.72 | 62.13±2.86 | 93.29±17.24 | 7 |
| Other soft-leaved forests | 58.49±19.51 | 75.32±27.58 | 95.36±35.06 | 17 |
| Other shrubs | 80.06 | 95.46 | 123.96 | 1 |
| Felling sites | 25.1±8.75 | 34.72±6.64 | 56.68±0.48 | 3 |
| Bogs | 257.06±20.86 | 417.6±70.26 | 539.2±114.8 | 18 |
| Arable land | 69.42±23.49 | 102.62±37.55 | 148.11±58.14 | 71 |
| Pastures | 77.62±22.68 | 110.4±30.47 | 156.84±39.37 | 46 |
| Hayfields | 85.06±19.85 | 111.07±25.84 | 145.6±33.48 | 102 |
| Gardens | 160.8 | 217.25 | 279.53 | 1 |
| Sparse forests | 117.58±96.67 | 143.19±122.48 | 175.44±156.03 | 80 |
Note:*SE – standard error
In general, for Russia, the ratio of carbon capacity in the 0–50 cm layer of non-forest land to forest land is 1.9. In the European part of the country, where there are a lot of bogs in the northern territories, this ratio rises to 3.0 (Chestnykh et al. 2004). Consequently, non-forest lands in the structure of forest cover lands act as the main accumulator of biological carbon in the entire biome of boreal forests. At the same time, the Csoil of the bogs determines the priorities of individual regions in the total carbon reserves of the forest cover lands, and not only in its non-forest lands.
This is clearly seen in Figure 1, which shows a map of the distribution of average stocks of soil carbon in the 0–50 cm layer over forest regions. It can be seen that the maximum mean values are observed in pre-tundra forests and northern taiga regions, as well as in the North Ural region. The minimum mean values are observed in the coniferous-deciduous area with a small share of non-forest lands. For the desert region, the data are absent at all, since they are not included in the database. Of interest are the data for the North Caucasus region with a total small area of 2.23 million ha, i.e. it is one of the smallest allotments, the mean values are significant reaching 112.07 t ha-1; total reserves are equal to 250 106 t that is explained by a large number of arable lands in this region.
| C t/ha |
| Soil layer of 0-50 cm |
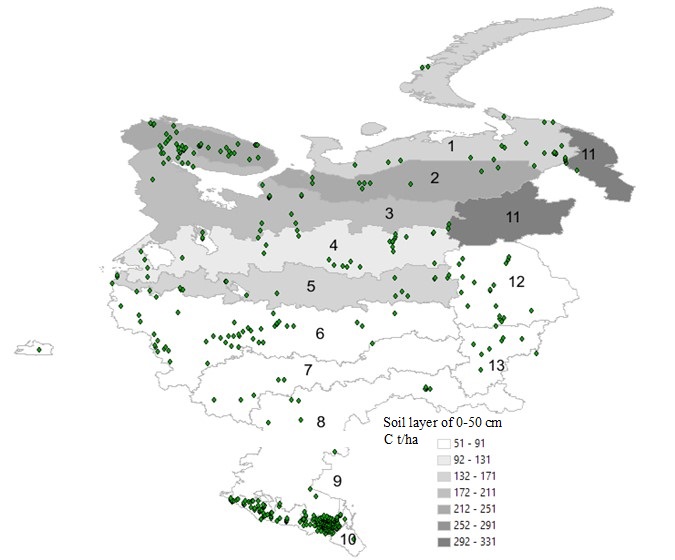
Figure 1. Average carbon reserves (t C ha-1) in the 0–50 cm soil layer in the forest cover lands of the European-Ural part of the Russian Federation
The distribution of profiles from the database of biotopes of forest regions in the European-Ural part of Russia is uneven (diamonds in the figure). There are biotopes, for which data are not available for some forest regions. For example, there is no data on “bogs” in the middle Ural, southern taiga area, and the area of coniferous-deciduous forests; there are no profiles in the widely represented aspen forests of the southern taiga, the middle and southern Urals; there is a lack of data on the larch and birch categories from the North Ural forest region, etc. (the listed biotopes occupy an area of more than 800 thousand ha in the corresponding forest regions). To further fill the database of soil characteristics, it is necessary either to use the literature resources, or to take field measurements to fill in the missing information.
CONCLUSION
The estimation of soil carbon stocks in the territory of the European-Ural part of Russia is made using the topologies adopted in the classification of categories of forest cover lands in the State Forest Inventory (SFI). The attribution of each profile to the forest region and the category of land (“biotope”) was established using the coordinates and descriptions of soil profiles from the available database (Chestnykh, Zamolodchikov, 2018). For each forest region of the European-Ural part of Russia, we obtained the shares of land cover variants (dominant species for forested lands and variants for unforested lands). The mean values of soil carbon for forest regions weighted over the areas of biotopes were obtained based on the representativeness of “biotopes” in forest regions. Thus, the average values of soil carbon were calculated by weighting the data on the proportions of the present category of land (biotope) in the corresponding forest area.
The final data are in good agreement with the estimates obtained earlier by other authors, although our results are hardly comparable with most published works due to the use of fundamentally different approaches to the spatial grouping of data. Namely, our data are aggregated according to biological “biotopic” criteria, while in most works by other authors the topological basis for aggregation consists in soil types themselves or soil maps.
One of the consequences of the work done was the identification of “holes” – biotopes, for which there is no soil data for some forest regions. It is desirable to perform appropriate work to obtain a more complete picture of the distribution of soil carbon in the forest cover lands.
ACKNOWLEDGEMENTS
The study was supported by the Russian Science Foundation No. 19-77-30015 “Development of methods and technologies for the integrated use of Earth remote sensing data from space for the development of a national monitoring system for the carbon budget of Russian forests in the context of global climate change”, conducted within the framework of the state task of the CEPL RAS No. АААА-А18-118052590019-7.
REFERENCES
Alekseev V.A., Berdsi R.A., Uglerod v ekosistemah lesov i bolot Rossii (Carbon in the ecosystems of forests and swamps of Russia), Krasnoyarsk: In-t lesa im. V.N. Sukacheva, 1994, 173 p.
Chestnykh O.V. Zamolodchikov D.G., Zapasy organicheskogo ugleroda v pochvah lesov Rossii (Organic carbon stock in the soils of Russian forests), Prirodnye i antropogennye ekosistemy: problemy i resheniya, 2017, Moscwa: Biblio–Globus, pp. 19-60.
Chestnykh O.V., Zamolodchikov D.G., BD «Pochvennye harakteristiki Severnoj Evrazii» (“Soil characteristics of Northern Eurasia”), certificate of state registration of the database in the Federal Service for Intellectual Property, No. 2018621164 of 05.17.2018.
Chestnykh O.V., Zamolodchikov D.G., Zavisimost’ plotnosti pochvennyh gorizontov ot glubiny ih zaleganiya i soderzhaniya gumusa (The dependence of the density of soil horizons on the depth of their occurrence and humus content), Pochvovedenie, 2004, No. 8, pp. 937-944.
Chestnykh O.V., Zamolodchikov D.G., Karelin D.V., Zapasy organicheskogo ugleroda v poch-vah tundrovyh i lesotundrovyh ekosistem (Stock of organic carbon in soils of tundra and forest-tundra ecosystems), Ekologiya, 1999, No. 6. pp. 426-432.
Chestnykh O.V., Zamolodchikov D.G., Utkin A.I., Obshchie zapasy biologicheskogo ugleroda i azota v pochvah lesnogo fonda Rossii (General stock of biological carbon and nitrogen in the soils of the forest fund of Russia), Lesovedenie, 2004, No. 4, pp. 30-42.
Efremova T.T., Efremov S.P., Melent’eva N.V., Zapasy i soderzhanie soedinenij ug-leroda v bolotnyh ekosistemah Rossii (Stock and content of carbon compounds in bog ecosystems of Russia), Pochvovedenie, 1997, No. 12, pp. 1470-1477.
Orlov D.S., Biryukova O.N., Suhanova N.I., Organicheskoe veshchestvo pochv Rossijskoj Federacii (Organic matter of the soil of the Russian Federation.), Moscow: Nauka, 1996, 254 p.
Pastuhov A.V., Kaverin D.A., Zapasy pochvennogo ugleroda v tundrovyh i taezhnyh ekosistemah Severo-Vostochnoj Evropy (Soil carbon reserves in the tundra and taiga ecosystems of North-Eastern Europe), Pochvovedenie, 2013, No. 9, pp. 1084-1094.
Rozhkov V.A., Vagner V.V., Kogut B.M., Konjushkov D.E., Sheremet B.V., Zapasy organicheskih i mineral’nyh form ugleroda v pochvah Rossii (Stock of organic and mineral forms of carbon in the soils of Russia), Uglerod v biogeocenozah: Chteniya pamyati akad. V.N. Sukacheva, XV, Moscow: Nauka, 1997, pp. 5-58.
Ryzhova I.M., Podvezennaya M.A., Prostranstvennaya variabel’nost’ zapasov organicheskogo ugleroda v pochvah lesnyh i stepnyh biogeocenozov (Spatial variability of organic carbon stock in the soils of forest and steppe biogeocenoses), Pochvovedenie, 2008, No. 12, pp. 1429-1437.
Shchepashchenko D.G., Muhortova L.V., Shvidenko A.Z., Vedrova E.F., Zapasy organicheskogo ugleroda v pochvah Rossii (Stock of organic carbon in the soils of Russia), Pochvovedenie, 2013, No. 2, pp. 123-132.
Shvidenko A., Nilsson S., A synthesis of the impact of Russian forests on the global carbon budget for 1961–1998, Tellus, 2003, 55B. pp. 391-415.
Stolbovoy V., Carbon in Russian Soils, Climatic Change, 2002, Vol. 55, No. 1-2, pp. 131-156.
Stolbovoy V., Soil carbon in the forests of Russia, Mitigation and Adaptation Strategies for Global Change, 2006, No. 11, pp. 203-222.
Stolbovoy V., Mccallum I., Land Resources of Russia (CD-ROM). IIASA & RAS. Laxenburg, Austria, 2002.
Titlyanova A.A., Kudryashova S.Ya., Kosyh N.P., Shibareva S.V., Bazy dannyh «Organicheskij uglerod» i «Zapasy rastitel’nogo veshchestva v ekosistemah Sibiri» kak sredstvo ocenki uglerodnogo balansa, ego modelirovaniya i prognozirovaniya na geoinformacionnoj osnove (Databases “Organic carbon” and “Stocks of plant matter in Siberian ecosystems” as a means of assessing the carbon balance, its modeling and forecasting on a geoinformation basis), Vychislitel’nye tekhnologii, 2007, Vol. 12, No. 2, pp. 131-139.
Utkin A.I., Zamolodchikov D.G., Chestnyh O.V., Korovin G.N., Zukert N.V., Lesa Rossii kak rezervuar organi-cheskogo ugleroda biosfery (Russian forests as a reservoir of organic carbon of the biosphere), Lesovedenie, 2001, No. 5, pp. 8-23.
Vaganov E.A., Vedrova E.F., Verhovec S.V., Efremov S.P., Efremova T.T., Kruglov V.B., … & Shibistova O.B., Lesa i bolota Sibiri v global’nom cikle ugleroda (Siberian forests and swamps in the global carbon cycle), Sbirskij ekologicheskij zhurnal, 2005, No. 4, pp. 631-649.
Vinson T.S., Kolchugina T.P., Pools and fluxes of biogenic carbon in the Former Soviet Union, Water, Air and Soil Pollution, 1993, No. 70, pp. 223-237.
Zamolodchikov D.G., Grabovskij V.I., Kraev G.N., Dinamika byudzheta ugleroda lesov Rossii za dva poslednih desyatiletiya (The dynamics of the carbon budget of the Russian forests over the past two decades), Lesovedenie, 2011, No. 6, pp. 16-28.
Zamolodchikov D.G., Korovin G.N., Utkin A.I., Chestnyh O.V., Songen B., Uglerod v lesnom fonde i sel’sko-hozyajstvennyh ugod’yah Rossii (Carbon in the forest fund and agricultural land of Russia), Moscow: KMK, 2005, 200 p.
Reviewer: PhD in biology, researcher Osipov A.F.
[1] Subsequent databases of the state forest inventory (SFI) are available only at the level of the constituent entities of the Russian Federation.