- DOI 10.31509/2658-607x-2020-3-1-1-14
Vegetation cover dynamics mapping of the curonian spit national park using ALOS and SENTINEL-2 satellite imagery
С текстом оригинальной статьи Вы можете ознакомиться по ссылке
![]()
Original Russian Text © 2019 A.D. Nikitina, S.V. Knyazeva, E.A. Gavrilyuk, E.V. Tikhonova, S.P. Eydlina, N.V. Koroleva, published in Forest Science Issues Vol. 2, No. 3, pp. 1-21
A.D. Nikitina*, S.V. Knyazeva, E.A. Gavrilyuk,
E.V. Tikhonova, S.P. Eydlina, N.V. Koroleva
Center for Forest Ecology and Productivity of the RAS
Profsoyuznaya st. 84/32 bldg. 14, Moscow, 117997, Russia
*E-mail: nikitina.al.dm@gmail.com
Received 24 June 2019
This article presents the results of assessing the quantitative changes in vegetation cover areas of the Curonian Spit national park (NP) using materials from high spatial resolution multi-temporal multispectral imaging from ALOS and Sentinel-2 satellites. Automated classification algorithms Random Forest and Maximum Likelihood Estimation were tested. Based on the obtained data of automated interpretation of satellite images, ecosystem monitoring indicators of the national park (forest cover percent, share of coniferous trees in stands, share of waving (open) sands and sands covered with vegetation (fixed sands) were calculated, and dynamic maps of these indicators as well as a map of multi-temporal state of vegetation were compiled. Cartographic assessment reflects the main trends in the dynamics of the Curonian Spit NP vegetation structure over the ten-year period from 2007 to 2017: an increased percent of forest cover, increased share of vegetation-fixed sands on the side the Curonian Lagoon as a result of forest protection measures; decreased forest cover percent and increased share of waving sands on the side of the sea coast as a result of foredune destruction under the influence of wind, wave and recreational loads.
Key words: vegetation cover, forest stands, high spatial resolution satellite data, classification of satellite images, automated interpretation, classification algorithms, recognition accuracy, indicators of environmental monitoring, dynamics maps
Remote sensing data (RSD) are one of the main sources for studying and mapping the complex structure of the vegetation cover. Satellite imagery with different spatial resolutions is widely used for vegetation dynamics analysis, forest inventory and mapping, assessing biodiversity and resource potential of forest ecosystems, etc. (Gould, 2000; Malysheva et al., 2002; McRoberts et al., 2010; Nagendra et al., 2013; Turner et al., 2015; Boisvenue et al., 2016; Komarova et al., 2016). RSD application for inventory, monitoring and protection of plant communities is reported in a number of foreign and domestic reviews (Malysheva, 2002; Suhih, Zhirin, 2005; Xie et al., 2008; Homolova et al., 2013; Banskota et al., 2014). The main factors influencing the spectral characteristics of woody plants are the ratio of pigments, internal structure features, and the overall percentage of leaf moisture. Green, red, and near-infrared (NIR) bands are the most informative optical bands in vegetation cover surveys. The frequency of taking images of the same areas of the Earth’s surface is especially important for vegetation cover monitoring, identification of objects or phenomena in the images and their changes over time. Multispectral satellite images with a spatial resolution of 10–30 m is useful for assessing the state of forest cover at the regional and local levels (Knyazeva, 2006; Labutina, Baldina, 2011; Ryazanov et al. 2015; Immitzer et al., 2016). Landsat images are most widely used for spatial analysis and monitoring of vegetation dynamics (Gavier-Pizarro et al., 2012; Kurbanov et al., 2013; Hansen et al., 2013; Rasskazov, Galaganova, 2014; Banskota et al., 2014; Chen et al., 2015; Koroleva et al., 2018). Mapping of the vegetation of terrestrial ecosystems at the regional level, the Center for Forest Ecology and Productivity of the RAS has developed methods based on Landsat–TM/ETM+/OLI satellite data (Gavrilyuk, Ershov, 2012). Multispectral survey systems with a spatial resolution of 10 m (ALOS, SPOT, Sentinel-2, and Canopus-B) are optimal for forests mapping at the local level, since they have both the sufficient spatial coverage and the necessary degree of detail of the imagery of natural objects. One more advantage of high-resolution satellite data is their significantly lower cost and greater availability as compared to ultra-high-resolution satellite images. Such satellite data is useful for assessing the vegetation cover dynamics of the Curonian Spit national park, the territory of which has a suboptimal shape for mapping and remote monitoring (it is narrow and winding, stretched diagonally in the north-south direction).
The Curonian Spit national park (NP) is located in the Zelenogradsky district of Kaliningrad Oblast of the Russian Federation, and covers an area of 66.21 km2 (according to the official website of the Curonian Spit NP). The NPs created on the Russian and Lithuanian parts of the Curonian Spit form the united UNESCO World Cultural and Natural Heritage site – the Curonian Spit. The Russian part of the Curonian Spit is 48 km long, its width ranges from 400 m to 4 km. The relatively small territory of the park is characterized by high landscape and cenotic diversity as well as rich species composition of forest communities. The Curonian Spit shows dynamic natural and anthropogenic impacts that have seasonal and annual fluctuations. Approximately 70% of natural landscapes of the Curonian Spit can be classified as semi-stable, unstable and highly unstable, which is due to constant intensive water and wind erosion as well as anthropogenic impacts (Shaplygina, Volkova, 2017). The main forest-forming species are pine, black alder, birch, and spruce. Over 77% of forest stands are of artificial origin (Chebakova, 1996). Common pine covers the majority of the forested area (about 50%). Pine forests are mainly represented by middle-aged stands or young forests on elevations. In the southern part of the Spit, wet-grass spruce forests grow in areas with good moistening. Black alder forests dominate in vast lower areas with excessive moisture (palve). About 25% of the forested area is occupied by small-leaved forests. Birch forests are dominated by various grasses and mosses, and the undergrowth is widely represented by raspberries and blackberries. A distinctive feature of the Curonian Spit is the presence of blown sands, which account for about 10% of the NP territory. Trees have been being planted on the Curonian Spit in order to fix the sands and the foredune has been being created since the 19th century. The existing balance may easily be disturbed due to current unreasonable economic activities and recreational loads, which will affect all the biotopes of the Curonian Spit (Gubareva, 2009). Monitoring of the state of the foredune and sand-fixing forests is one of the priorities for landscape conservation of the Curonian Spit protected area and UNESCO World Cultural and Natural Heritage site. Thus, keeping track of changes in the spatial structure of the vegetation cover is particularly relevant, since the coastal-marine ecosystems of the peninsula are facing constant intensive influence of various environmental factors, and are easily vulnerable and highly dynamic.
The objective of this study is to identify the changes in the areas of the main types of vegetation of the Curonian Spit NP under the influence of abiotic, biotic and anthropogenic factors for the period of 2007–2017 based on ALOS and Sentinel-2 multi-temporal multispectral satellite data of high spatial resolution.
MATERIALS AND METHODS
To study the dynamics of vegetation cover, multi-temporal composites are often created based on a series of images obtained for the same territory at different times (Tyutrin, Kondratovec, 2010; Yaldygina, 2011; Hansen et al., 2013; Grankina, Mishvelov, 2014; Banskota et al., 2014). However, this method is only suitable for satellite images obtained under the same shooting conditions with the same equipment. Errors occurring when combining satellite data from different survey vehicles significantly impair the interpretation properties of the synthesized image. However, it is not always possible to use satellite imagery of a single camera for long-term monitoring of vegetation due to the limited lifetime of satellites and camera equipment. In most cases, satellite data obtained by different survey systems are used for research. Therefore, for each image, automated classification is performed first, and further dynamics analysis is based on the comparison of interpretation results.
The study is based on the data from environmental monitoring conducted in the Curonian Spit NP in 1998–2007 (Malysheva et al., 2002; Knyazeva, 2006).
Analysis and mapping of vegetation dynamics of the Curonian Spit NP was carried out based of the results of automated interpretation of multi-temporal multispectral satellite images of high spatial resolution – 10 m. The 2007 image was made by the ALOS satellite, and the 2017 image was made by the Sentinel-2 satellite. Shooting dates were selected to fall approximately in the middle of the vegetation period (June–July). Sentinel-2 satellite images from early May 2016 and mid-January 2017 were also used as auxiliary materials when creating the set of references for classification. Sentinel-2 satellite images are obtained from the EOBrowser database (apps.sentinel-hub.com) with open access.
Satellite data for assessing vegetation dynamics was chosen based on similar characteristics of the spatial and spectral resolution of images, which allow for optimal classification results for the specified survey parameters (Table 1).
Table 1. Characteristics of high spatial resolution data used to identify vegetation dynamics
|
Satellite |
Operational lifetime |
Spatial resolution, m |
Spectral range of bands, μm |
Shooting date |
|
Alos (Japan) |
October 24, 2006 – April 22, 2011 |
10 |
green: 0.52–0.6 |
June 11, 2007 |
|
red: 0.61–0.69 |
||||
|
NIR: 0.76–0.89 |
||||
|
Sentinel-2* (EU) |
June 23, 2015 – till present |
10 |
green: 0.54–0.58 |
July 20, 2017 |
|
red: 0.64–0.68 |
||||
|
NIR: 0.78–0.9 |
The survey materials were pre-processed at Level-1C with zero clouds and presented in the WGS 84 / UTM zone 34N projection. ERDAS Imagine software synthesized green, red, and NIR band images as the most informative ones for studying vegetation cover, and cut out a fragment of the territory of the Russian part of the Curonian Spit.
Satellite and cartographic data on forest management were combined through the transformation of multi-zone images using affine transformations in the ArcGIS software package (transformation error did not exceed 1-2 pixels).
For automated classification, the taxational database of 2003 NP forest management data and the data from 2017 field ground surveys of forest vegetation on the territory of the NP were used as the data for training and checking the classification accuracy.
The biometric parameters of stands within the 2017 expedition were measured by
exploratory and instrumental survey methods on 50×50, 30×30, and 20×20 m test plots and schematic maps of tree locations were drawn. 15 key plots were laid in total in different types of forest: 12 in pine forests of different ages (young, middle-aged and old-aged stands), 1 in birch, 1 in black alder, and 1 in spruce forests. The age of young pine forests was up to 40 years, of middle-aged ones – ranged from 41 to 80 years, old-aged pine forests included stands of ripening and mature groups aged from 81 to 140 years.
The reference training samples for forest vegetation which involved the forest management database were compiled according to the following parameters: share of the predominant species is over 6 units in the stand; the fullness is over 0.6. Sampling of stands by age was made only for pine forests, since they are represented by a full age range and occupy a significant area. The references for other non-forest classes (meadow vegetation, psammophilic vegetation, sands, and water bodies), were created based on the results of visual interpretation of images and field data from surveys of the park territory. Homogeneous areas of the image were selected within the forest taxation plots (groups of plots) or selected objects. The same training areas (not subject to changes) with the exception of the southern part of the Curonian Spit (which is not covered by the ALOS image) and the class of non-closed pine trees as the most dynamic object were selected for multi-temporal images. When classifying pine forests by age, reference areas in the middle of the age range were selected. Representative sets of standards were formed for 11 classes, i.e. water bodies; open sand dunes and beach; psammophilic vegetation on dunes; meadow vegetation; non-closed pine trees; young pine forests (up to 40 years); middle-aged pine forests (41–80 years); old-aged pine forests (81–140 years); spruce forests; small-leaved forests (birch, aspen); and black-alder forests. 255 reference plots with a total area of 575 ha (31,699 samples) for ALOS imagery and 270 plots with an area of 594 ha (34,418 samples) for Sentinel-2 imagery were chosen (2016 and 2017) in total.
The Maximum Likelihood Estimation and Random Forest methods (Breiman, 2001) were chosen for ALOS and Sentinel-2 satellite imagery classification. Multi-temporary satellite images were classified in the free development framework of the RStudio software.
Random Forest classification was performed by constructing 1,000 trees based on 3 spectral bands of the satellite image. The training sample was divided into 2 groups: reference plots for training and control plots for verification. The used algorithm allows assessing the predicted accuracy of class definition, calculated on the basis of the initial training sample as well as to identify the most important features used for classification. Our version of pixel-by-pixel classification claims the spectral images obtained in the red and near-IR survey bands to be the most informative features, which is further confirmed by the curves of spectral images that show the greatest separability of standards in these ranges.
Classification accuracy was evaluated using the Cohen’s kappa coefficient (Cohen, 1960). The results are presented in Table 2. The Random Forest classification has demonstrated more accurate results as compared to the maximum likelihood estimation. Thus, the Random Forest method was chosen for further analysis of the results.
During the analysis of the matrix of defining thematic classes error (confusion), the maximum recognition error regarding the objects from ALOS image was found in the
old-aged pine class and amounted to 48%.
The confusion mostly occurs between different age brackets of pine forests. A small part of the old-aged pine forest was recognized as birch forests. Besides, there is a fairly significant error in birch stands recognizing (39%), while most of the incorrectly assessed birch forests were classified as black alder and, to a lesser extent, as pine forests. The overall classification accuracy, represented by Kappa coefficient, is quite high: 0.825. The maximum error when recognizing forest vegetation classes on the basis of Sentinel-2 images was shown by the old-aged pine forest (53%) and spruce forest (68%) classes. Overall classification accuracy is 0.8.
Table 2. Overall accuracy and kappa coefficient for classifications of satellite images used
|
Method |
Maximum likelihood estimation |
Random Forest |
||
|
Satellite image |
Kappa coefficient |
Accuracy (average) |
Kappa coefficient |
Accuracy (average) |
|
ALOS |
0.8118 |
84.31 |
0.825 |
85.48 |
|
Sentinel-2 (2017) |
0.7108 |
74.31 |
0.8055 |
83.75 |
The black alder forest class is recognized most accurately, according to ALOS and Sentinel data: the classification error does not exceed 8%. The biggest classification errors correspond to the birch, spruce and pine forest classes of different age groups (mainly old-aged). Curonian Spit forests with the predominance of spruce and birch are more heterogeneous and mosaic than pine and black alder forests. Black alder hardly creates any mixed stands on the spit and is represented mainly by 65 to 90 years old stands. The confinedness of black alder to terrain depressions and, as a result, to excessive moisture, and pine trees confinedness to elevated dry habitats allow forming more compact homogeneous spectral signatures than those for other classes. The greatest confusion of pine forest classes occurs between the age groups of pine; therefore, these classes may be united. It also seems appropriate to unite the classes of psammophilic vegetation and non-closed pine crops, as both classes belong to non-forested lands, and the reference areas of non-closed stands occupy too small an area in comparison with other classes. For the same reason, and because the ALOS image, unlike the Sentinel image, does not cover the entire NP territory, the spruce forests class was united with the pine forest class. Classifications of the Curonian Spit vegetation after the classes were united for ALOS and Sentinel images are shown in Fig. 1.
The threshold for guaranteed repeatability of small compact objects (without their shape reproduction) at pixel generalization is 4 pixels (Kravcova, 2000). Thematic classification rasters were filtered using the function of neighbourhood analysis choosing 3×3 sliding window to reduce image fragmentation and exclude random classes (the area of which is less than 1 pixel, which is equal to 100 m2). It facilitates the quantification of the changes in the areas of the Curonian Spit vegetation over a 10-year period within the net of rides with the minimum accuracy of 0.1 ha (9 pixels).
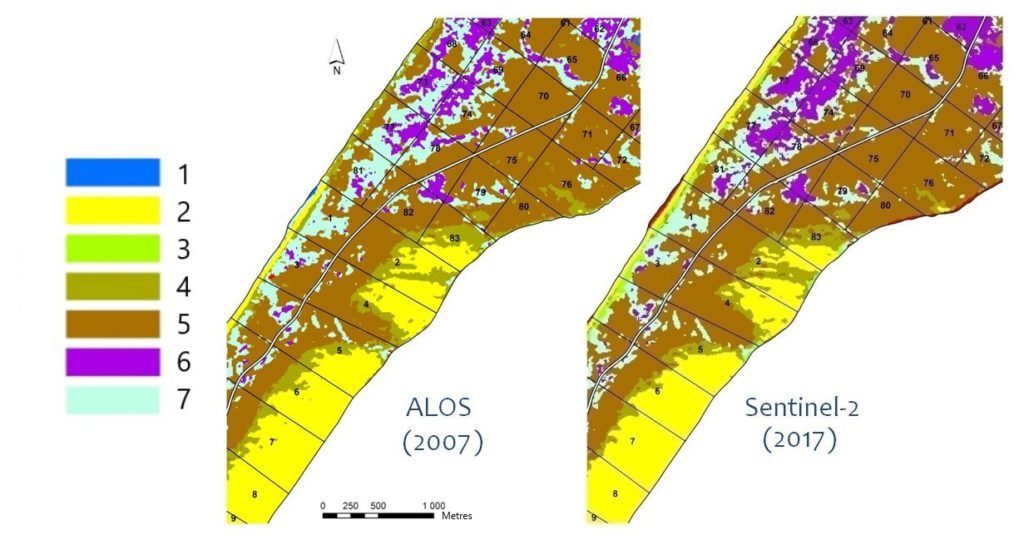
Figure 1. Results of the Curonian Spit vegetation classification after combining classes for ALOS and Sentinel images; classes: 1 – water bodies, 2 – sand dunes, beach,
3 – meadow vegetation, 4 –psammophilic vegetation, 5 – pine forests,
6 – black alder forests, 7 – birch forests
It is advisable to use relative area parameters that characterize the stability of vegetation cover on the territory of the peninsula as indicators of dynamics for mapping. Such indicators were proposed by a group of scientists to organize and conduct remote environmental monitoring in protected natural areas (Malysheva et al., 2002; Knyazeva, 2006). For the Curonian Spit, it was proposed to use the forest cover percent (FC) of the territory (1) and the share of conifers (C) in the stand (2) as universal indicators, whereas the share of waving sands (WS) (3) and the share of sands covered with vegetation (VCS) (4) – as specific indicators for this territory.
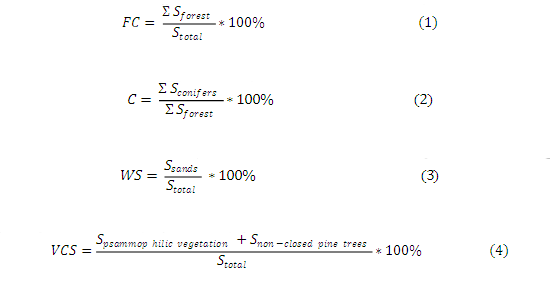
A territorial observation unit, i.e. a forestry compartment was identified to calculate the quantitative values of the indicators. ArcGIS software package and spatial analysis (vector overlay, calculation of area characteristics) and geoinformation mapping methods were used to calculate the dynamics indicators and to compile maps. Calculation of the difference between the values of each indicator in 2017 and 2007 formed the basis for dynamics mapping. The indicators assessed were the forest cover percent, share of coniferous trees, shares of waving (open) sands and sands covered with vegetation (fixed sands).
A map of the multi-temporal state of vegetation was compiled based on the results of automated interpretation of satellite images for the Curonian Spit NP. The map reflects changes in the boundaries (contours) of plant communities and displays the combined borders of classes in 2007 and 2017 using the qualitative background technique (types of plant communities and natural objects in 2007 are filled with colour, and those in 2017 are shaded with colour).
RESULTS AND DISCUSSION
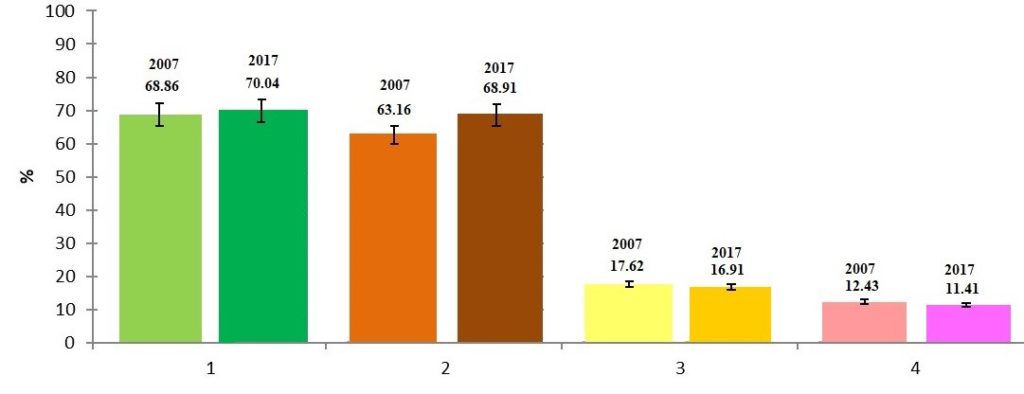
Class structure of plant communities for forestries of the Curonian Spit NP in 2007 and 2017 was analysed based on the results of classification of multi-temporal satellite images. In all cases, the share of forest stands exceeds 68%, with a maximum percentage of 72.2% in 2017. In general, the species structure is characterized by the predominance of pine forests (over 40%). Their share has slightly increased by 2017 (from 42 to 44% in Zolotye Dyuny forestry and from 43 to 48% in Zelenogradskoye forestry). The share of birch forests ranges from 13 to 19% with the decrease by 2017. Black alder forests account for the smallest share in the forest cover structure. Thus, the overall structure of the forest cover of the NP territory only slightly changed over the 10-year period from 2007 to 2017. When analyzing the dynamics indicators calculated for the Zelenogradskoye and Zolotye Dyuny forestries, we can conclude that there were no significant changes in the territory of the forestries as a whole during the period from 2007 to 2017 (Fig. 2).
The change in forest cover percent does not exceed 3%, and the change in waving sands is not more than 1%.
A
B
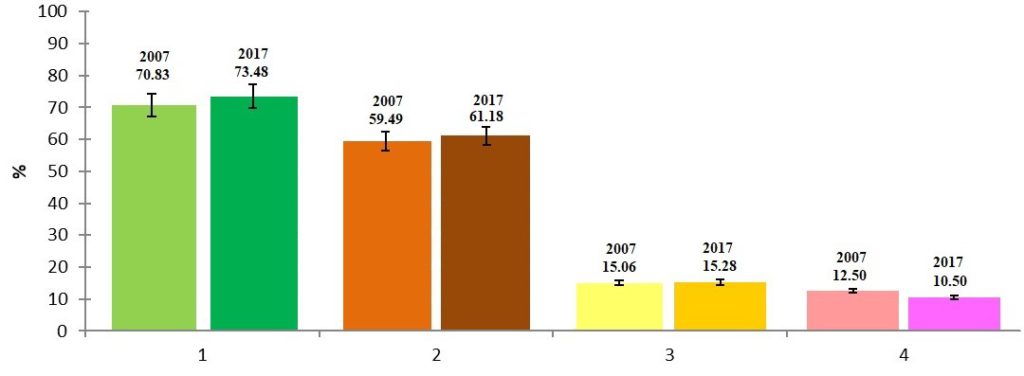
Figure 2. Indicators of vegetation cover dynamics of the Curonian Spit NP for the forestries:
A) Zelenogradskoye; B) Zolotye Dyuny: 1 – forest cover percent; 2 – share of coniferous trees;
3 – share of waving sands; 4 — share of fixed sands
More detailed spatial dynamics of indicators may be estimated when analyzing the values for each forestry compartment. Changes in forest cover percent within the NP territory ranges from -18 to 30%. Notably, the minimum and maximum values are presented in singular compartments, whereas the majority of the changes lies in the range of -9 to 10% (Fig. 3).
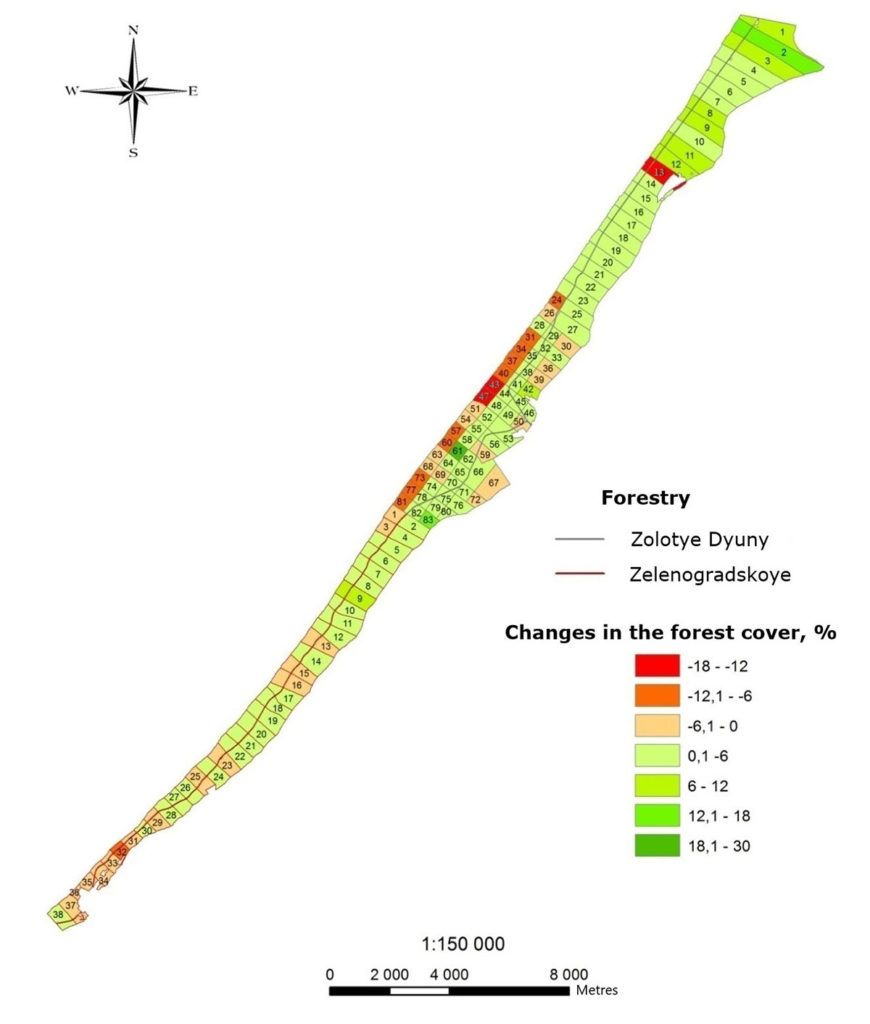
Figure 3. Changes in the forest cover percent of the Curonian Spit National park
in the period 2007-2017
The highest increase in forest cover percent is observed in the 61st compartment of the Zolotye Dyuny forestry (29.5%) where windthrow areas of the early 2000s are overgrown with pine forests. Also, a relatively large increase in forest cover percent is seen in compartments bordering Lithuania due to overgrowth of the foredune and sand fixation with psammophilic vegetation.
Negative trends of forest cover percent are typical of compartments located on the sea coast, which is caused by intensive erosion and abrasion processes on the coastal foredune. Annual storms erode sands covered with psammophilic vegetation and severe storms also disrupt forest communities. The maximum decrease in this indicator was noted in the 43rd compartment of the Zolotye Dyuny forestry ( 17%). It is also worth noting that some of the detected changes are predetermined by the classification error that occurs as a result of high fragmentation of the foredune vegetation cover, and does not allow for reliable interpretation of vegetation types based on the satellite data of the used resolution. In the 13th compartment, a 12% decrease in forest cover was associated with a fire in 2014, when significant areas of pine stands near Morskoye village burned down (Fig. 4). Pine trees have currently been planted on the burnt area.
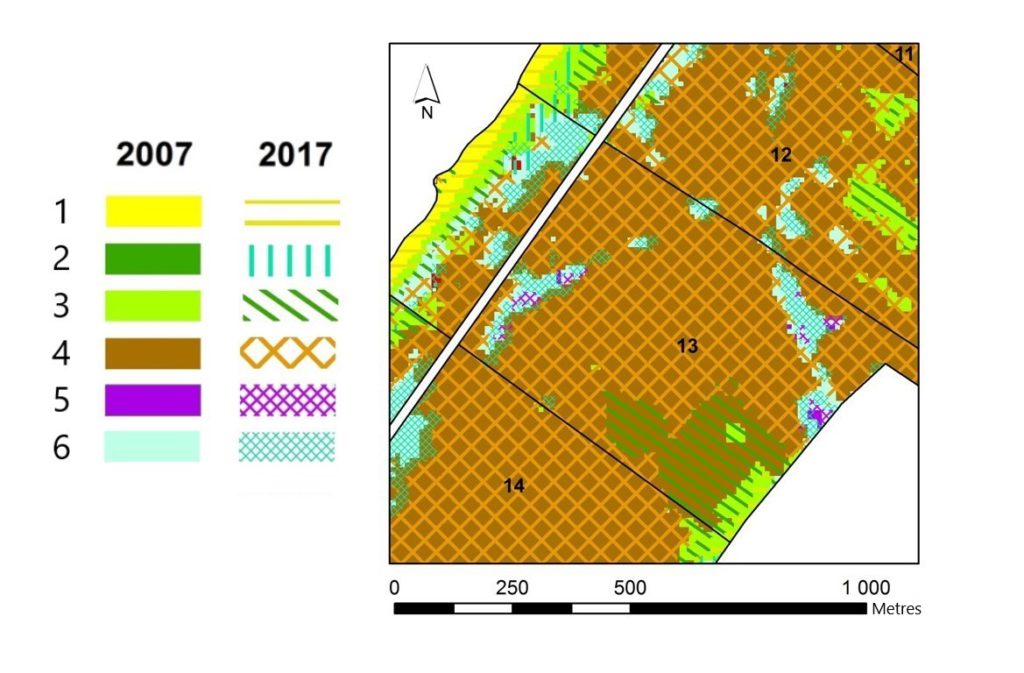
Figure 4. Fragment of the map of the multi-temporal state of vegetation on the territory of the 13th quarter of Zolotye Dyuny forestry. Classes: 1 – sand dunes, beach, 2 – meadow vegetation, 3 – psammophilic vegetation, 4 – pine forests, 5 – black alder forests, 6 – birch forests
The dynamics of the share of waving sands reflects the processes of fixing free-moving sand dunes with the help of various forestry measures, for example planting psammophytes and pine trees. The proportion of waving sands ranges from -13 to 11% over a ten-year period (Fig. 5).
There is a maximum decrease in the share of waving sands in the 12th compartment (by 12.8%) due to sand fixation with psammophilic vegetation (Fig. 6). Also, the decrease in blown sands was recorded in the compartments bordering Lithuania. The increase in the share of blown sands occurred in the compartments confined to the sea coast.
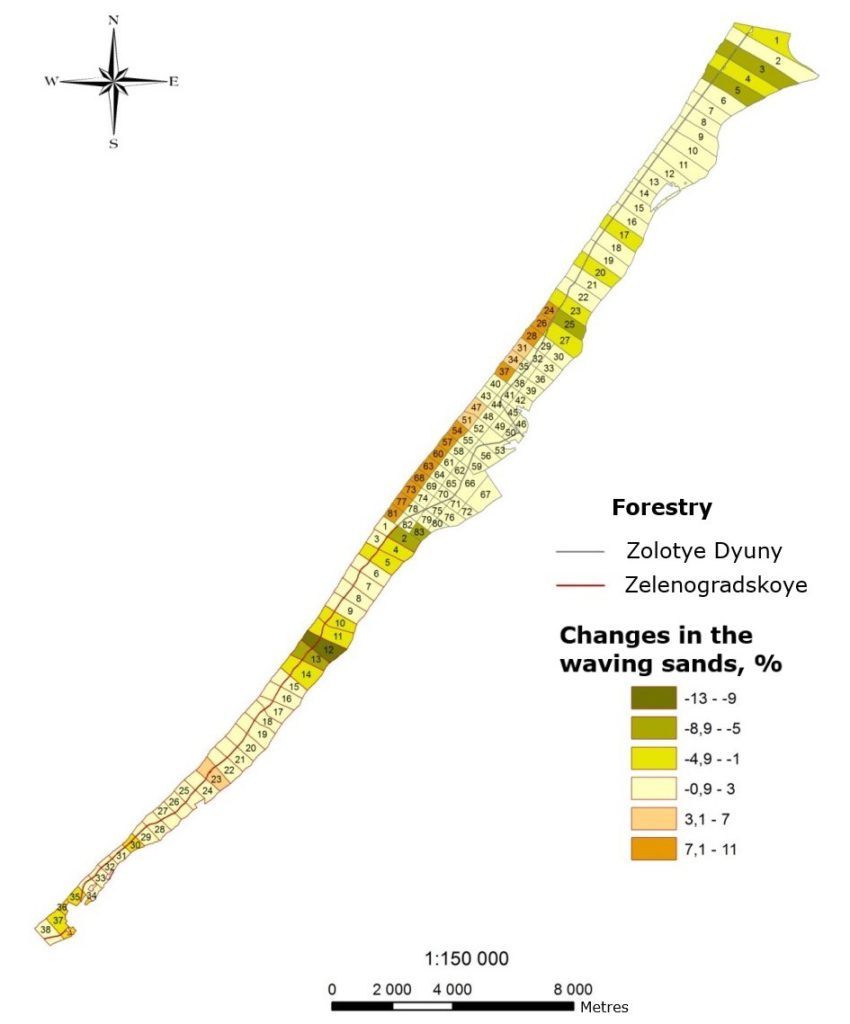
Figure 5. Dynamics of the waving sands of the Curonian Spit National park
in the period 2007-2017.
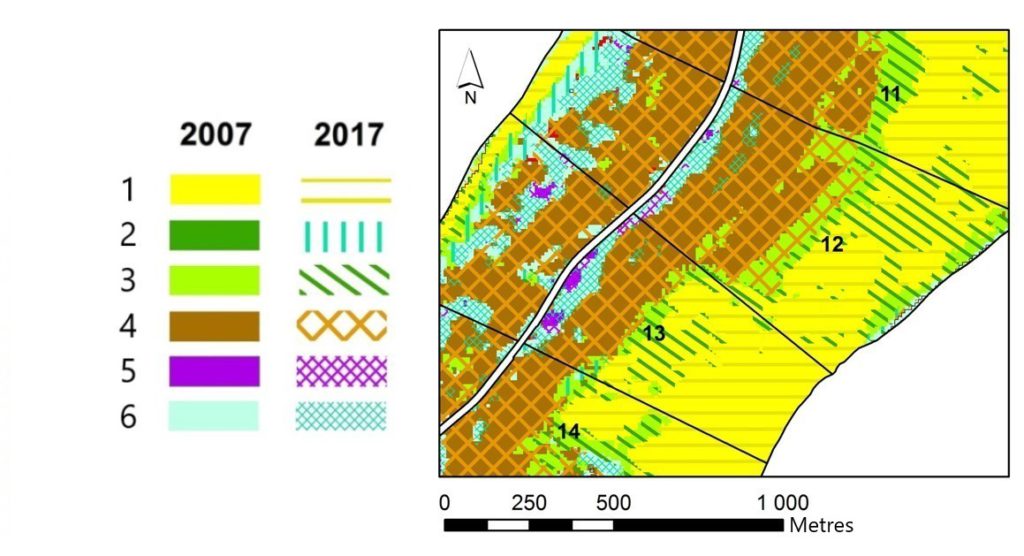
Figure 6. Fragment of a map of the multi-temporal state of vegetation on the territory of the 12th and 13th compartments of Zelenogradskoye forest district. Classes: 1 – sand dunes, beach, 2 – meadow vegetation, 3 – psammophilic vegetation, 4 – pine forests, 5 – black alder forests, 6 – birch forests
CONCLUSION
The study has revealed that satellite data with the 10 m resolution have an optimal combination of details level and visibility for the interpretation of the main types of vegetation of the Curonian Spit due to the complex elongated shape of the peninsula. Using RSD made it possible to identify and quantify the changes in the vegetation cover in the Curonian Spit NP over a 10-year period within the net of rides with an accuracy of at least 0.1 ha. However, a section of the coastal protecting foredune with strongly fragmented vegetation cover requires the survey materials with the higher spatial resolution.
The comparative analysis of the classification algorithms with training, the Maximum Likelihood Estimation and the Random Forest methods, has shown that both
algorithms are good at identifying and evaluating vegetation characteristics (Kappa coefficient 0.78 and 0.8, respectively). However, Random Forest demonstrated higher accuracy in recognizing main natural objects on the Curonian Spit (in particular, higher probability of recognition of the majority of the classes of forest vegetation).
This algorithm is also preferable because of flexible settings of classification parameters and less stringent requirements to the representativeness of training references as compared to statistical classifiers, which include the maximum likelihood estimation.
The results of interpreting multi-temporal satellite images revealed new data on the changes in vegetation cover areas of the NP territory in 2007–2017; based on these results,a series of maps of the main indicators of vegetation dynamics and a map of the multi-temporal state of vegetation were compiled. The maximum decrease in the forest cover percent (-17%) was observed in the foredune — the most dynamic NP object, whereas the maximum increase (29%) was revealed in the areas of windthrows of the year 2000, which are intensively overgrowing. The largest decrease ( 12%) in the area of waving sands not covered with vegetation occurs on the NP territory bordering with Lithuania as a result of the measures to fix waving sand dunes. In general, the following trends are observed when assessing the changes in the structure of the NP vegetation cover: increase in the forest cover percentage and share of vegetation-fixed sands on the side of the Curonian Lagoon as a result of forest protection measures; decrease in the forest cover percentage and increase in the share of waving sands on the sea coast as a result of foredune destruction under the influence of wind-wave and recreational load.
ACKNOWLEDGEMENTS
Field studies and automated interpretation of satellite data was performed with financial support of the Russian Foundation for Basic Research (project 17-05-01129 «Evaluation of biometric and morphological parameters of forest phytocenoses on the basis of detailed aerospace survey»), cartographic assessment of vegetation on the Curonian Spit was carried out in the framework of the state assignment AAAA-A18-118052400130-7, «Methodological approaches to the assessment of the structure and functioning of forest ecosystems.»
We express our gratitude to the employees of the Curonian Spit national park for their assistance in the arrangement and conducting of the field work.
REFERENCES
Banskota A., Kayastha N., Falkowski M., Wulder M.A., Froese R.E., White J.C., Forest monitoring using Landsat time-series data: A review, Canadian Journal of Remote Sensing, 2014, Тom 40, No. 5. pp. 362-384.
Boisvenue C., Smiley B.P., White J.C., Kurz W.A., Wulder M.A., Integration of Landsat time series and field plots for forest productivity estimates in decision support models, Forest Ecology and Management, 2016, Тom 376, pp. 284-297.
Breiman L., Random forests, Machine learning, 2001, Тom 45. No. 1. pp. 5—32.
Chebakova I.V., Nacional’nye parki Rossii, Moscow: Izd-vo Centra ohrany dikoj prirody, 1996, p. 198.
Chen Y., Dengsheng L., Geping L., Jingfeng H., Detection of vegetation abundance change in the alpine tree line using multitemporal Landsat Thematic Mapper imagery, International Journal of Remote Sensing, 2015, Тom 36, No.18, pp. 4683-4701.
Cohen J., A coefficient of agreement for nominal scales, Educational and Psychological Measurement, 1960, Vol. 20, No.1, pp. 37-46.
Gavier-Pizarro G.I., Kuemmerle T., Hoyos L.E., Stewart S.I., Huebner C.D., Keuler N.S., Radeloff V.C., Monitoring the invasion of an exotic tree (Ligustrum lucidum) from 1983 to 2006 with Landsat TM/ETM+ satellite data and Support Vector Machines in Córdoba, Argentina, Remote Sensing of Environment, 2012, Vol. 122, pp. 134-145.
Gavrilyuk E.A., Ershov D.V., Metodika sovmestnoj obrabotki raznosezonnyh izobrazhenij Landsat-TM i sozdaniya na ih osnove karty nazemnyh ekosistem Moskovskoj oblasti (Methods of joint processing of Landsat-TM multi-season images and creating on their basis maps of terrestrial ecosystems of the Moscow Region), Sovremennye problemy distancionnogo zondirovaniya Zemli iz kosmosa, 2012, Tom. 9, No. 4, pp. 15-23.
Gould W., Remote sensing of vegetation, plant species richness, and regional biodiversity hotspots, Ecological applications, 2000, Vol. 10, No. 6, pp. 1861-1870.
Grankina A.A., Mishvelov E.G., Sostoyanie i dinamika lesnyh fitocenozov osobo ohranyaemyh prirodnyh territorij Kavkazskih mineral’nyh vod v usloviyah rekreacionnogo vozdejstviya (State and dynamics of forest phytocenoses of Caucasian mineral waters specially protected natural territories under the conditions of recreational impact), Nauka. Innovacii. Tekhnologii, 2014, No. 4, pp. 121—129.
Gubareva I.Yu. Botanicheskie ob»ekty (Botanical objects). Osobo cennye prirodnye i kul’turnye ob»ekty nacional’nogo parka «Kurshskaya kosa»: sb. nauch. st. sost. O.V. Ryl’kov, I.P.ZHukovskaya (Especially Valuable Natural and Cultural Objects of the Curonian Spit National Park: Coll. of Sc. Art.,Comp. O.V. Rylkov, I.P. ZHukovskaya), Kaliningrad, Izd-vo RGU im. I. Kanta, 2009, pp. 9-36.
Hansen M.C., Potapov P.V., Moore R., Hancher M., Turubanova S.A., Tyukavina A. et al., High-resolution global maps of 21st-century forest cover change, Science, No. 342 (6160), pp. 850-853.
Homolova L., Malenovsky Z., Clevers J.G., Garcia-Santos G., Schaepman M.E., Review of optical-based remote sensing for plant trait mapping, Ecological Complexity, 2013, Vol. 15, pp. 1-16.
http://www.park-kosa.ru (2019, 27 June).
https://apps.sentinel-hub.com/eo-browser (2019, 27 June).
Immitzer M., Vuolo F., Atzberger C. First experience with Sentinel-2 data for crop and trees species classifications in central Europe, RemoteSensing, 2016, Vol. 8, No. 3, p. 166
Knyazeva S.V., Kartografo-aehrokosmicheskij monitoring lesov nacional’nyh parkov: Dis.kand.geogr.nauk (Cartographic-aerospace monitoring of national parks forests: the dissertation of the geographical sciences candidate), Moscow, MSU, 2006.
Komarova A.F., Zhuravleva I.V., YAblokov V.M., Otkrytye mul’tispektral’nye dannye i osnovnye metody distancionnogo zondirovaniya v izuchenii rastitel’nogo pokrova (Open multispectral data and main methods of remote sensing in the study of vegetation), Principy ekologii, 2016, No. 1 (17), pp. 40-74.
Koroleva N.V., Tihonova E.V. Ershov D.V., Saltykov A.N., Gavrilyuk E.A., Pugachevskij A.V., Ocenka masshtabov zarastaniya nelesnyh zemel’ v nacional’nom parke “Smolenskoe poozer’e” za 25 let po sputnikovym dannym Landsat (Assessment of the extent of non-forest lands growing in the Smolensk Lakeland National Park for 25 years using satellite data Landsat), Lesovedenie, 2018, No. 2, pp. 83-96.
Kravcova V.I., Generalizaciya aehrokosmicheskogo izobrazheniya: kontinual’nye i diskretnye snimki (Aerospace Image Generalization: Continuous and Discrete Images), Moscow, Izd-vo Mosk. un-ta, 2000, 256 p.
Kurbanov E.A., Vorob’ev O.N., Nezamaev, S.A., Gubaev A.V., Lezhnin S.A., Polevshchikova Yu.A., Tematicheskoe kartirovanie i stratifikaciya lesov Marijskogo Zavolzh’ya po sputnikovym snimkam Landsat (Thematic mapping and stratification of Mari Trans-Volga forests using Landsat satellite imagery), Vestnik Povolzhskogo gosudarstvennogo tekhnologicheskogo universiteta. Seriya: Les. Ekologiya. Prirodopol’zovanie, 2013, No. 3 (19), pp. 82—92.
Labutina I.A., Baldina E.A., Ispol’zovanie dannyh distancionnogo zondirovaniya dlya monitoringa ekosistem OOPT (Use of remote sensing data for monitoring ecosystems of protected areas), Moscow: WWF Rossii, 2011, p. 88.
Malysheva N.V., Orlova O.L., Knyazeva S.V., Zolina T.A., Vukolova I.A., Monitoring lesnyh ehkosistem nacional’nyh parkov s ispol’zovaniem distancionnyh metodov i GIS-tekhnologij. Metodicheskie podhody i opyt rabot (Monitoring forest ecosystems of national parks using remote sensing methods and GIS technologies. Methodical approaches and work experience), Lesohozyajstvennaya informaciya, 2002, No. 12, pp. 19-24.
McRoberts R.E., Cohen W.B., Næsset E., Stehman S.V., Tomppo E.O. Using remotely sensed data to construct and assess forest attribute maps and related spatial products, Scandinavian Journal of Forest Research, 2010, Vol. 25, No. 4. pp. 340-367.
Nagendra H., Lucas R., Honrado J.P., Jongman R.H., Tarantino C., Adamo M., Mairota P. Remote sensing for conservation monitoring: Assessing protected areas, habitat extent, habitat condition, species diversity, and threats, Ecological Indicators, 2013, Vol. 33, pp. 45—59.
Rasskazov A.A., Galaganova L.A., Ispol’zovanie dannyh LANDSAT dlya ocenki dinamiki izmenenij rastitel’nogo pokrova na territorii Meshchery (Use of LANDSAT data to assess changes in vegetation cover in Meshchera), Nauchnye trudy Instituta nepreryvnogo professional’nogo obrazovaniya, 2014, No. 3, p. 236.
Ryazanov S.S., Sahabiev I.A., Galimov D.Z., Klassifikaciya zemnogo pokrova ostrovov Kujbyshevskogo vodohranilishcha s ispol’zovaniem dannyh distancionnogo zondirovaniya (Classification of the land cover of the islands of the Kuibyshev reservoir using remote sensing data), Rossijskij zhurnal prikladnoj ekologii, 2015, No. 3 (3), pp. 50-55.
Shaplygina T.V., Volkova I.I., Geoehkologicheskie aspekty rekreacionnogo prirodopol’zovaniya v nacional’nom parke “Kurshskaya kosa” (Geoecological aspects of recreational environmental management in the Curonian Spit National Park). Sb. materialov vserossijskoj nauchno-prakticheskoj konferencii “Problemy prirodopol’zovaniya, sohraneniya bioraznoobraziya i kul’turnogo naslediya na osobo ohranyaemyh prirodnyh territoriyah Rossii” (Materials Collection of the Russian Scientific-Practical Conference «Problems of Nature Management, Biodiversity Conservation and Cultural Heritage in Specially Protected Natural Areas of Russia»), Kaliningrad, Izd-vo BFU im. Im. I. Kanta, 2017, pp. 128—134.
Suhih V.I., Zhirin V.M., Primenenie skanernyh kosmicheskih snimkov pri inventarizacii rezervnyh lesov (The use of scanner satellite images in the inventory of reserve forests), Distancionnye metody v lesoustrojstve i uchete lesov. Pribory i tekhnologii: Materialy Vserossijskogo soveshchaniya-seminara s mezhdunarodnym uchastiem (Remote Methods in Forest Management and Forest Accounting. Instruments and Technologies: Materials of the All-russian Meeting-Seminar with International Participation.), Krasnoyarsk: Institut lesa im. V.N. Sukacheva SO RAS, 2005, p. 92.
Turner W., Rondinini C., Pettorelli N., Mora B., Leidner A.K., Szantoi Z., Buchanan G., Dech S., Dwyer J., Herold M., Koh L.P., Leimgruber P., Taubenboeck H., Wegmann M., Wikelski M., Woodcock C., Free and open-access satellite data are key to biodiversity conservation, Biological Conservation, 2015, Vol. 182, pp. 173-176.
Tyutrin S.A., Kondratovec R.B., Distancionnyj monitoring nezakonnyh rubok v Dal’nevostochnom federal’nom okruge (Remote monitoring of illegal logging in the Far Eastern Federal District), Zemlya iz kosmosa: naibolee ehffektivnye resheniya. 2010, No. 4, pp. 73-76.
Xie Y., Sha Z., Yu M., Remote sensing imagery in vegetation mapping: a review, Journal of plant ecology, 2008, Vol. 1, No. 1. pp. 9-23.
Yaldygina N.B., Ispol’zovanie programmnogo kompleksa ENVI dlya resheniya zadach lesnogo hozyajstva (Using the ENVI software package for solving forestry problems), Geomatika, 2011, No. 3, pp. 34-39.
Reviewer: PhD in geography, associate professor Malysheva N.V.