- DOI 10.31509/2658-607x-2019-2-2-1-19
Dynamic pattern of carbon balance in the forests of federal districts of the Russian Federation
Original Russian Text © 2018 D.G. Zamolodchikov, V.I. Grabowsky, O.V. Chestnykh, published in Forest Science Issues Vol. 1, No. 1, pp. 1-24
![]() © 2019 г.
© 2019 г.
D.G. Zamolodchikov1,2, V.I. Grabowsky1, O.V. Chestnykh1,2
1Center for Forest Ecology and Productivity of the RAS
Profsoyuznaya st. 84/32 bldg. 14, Moscow, 117997, Russia
2 Lomonosov Moscow State University
Leninskie Gory 1 bldg. 12, Moscow, 119991, Russia
Received 04 September 2018
According to the data of the State Forest Registry and the archive materials of the State Forest Fund Account carbon budget of the forests of federal districts (FDs) of Russia was calculated for the years 1988–2015. The total carbon pool of the forested lands of Russia amounted to 123.77±18.93 Gt C as of 01.01.2015. The biggest contribution to the national forest carbon pool was made by Siberian (36.4%) and the Far Eastern (35.2%) FDs followed by the Northwestern (11.3%), Ural (9.3%), Volga (4.4%), the Central (2.8%), North Caucasian (0.3%) and the Southern (0.2%) FDs. Contribution to the national forest carbon sink (206.10±66.86 Mt C yr -1) by districts: the Siberian district 39.3%, the Far Eastern 15.1%, the Northwestern 12.4%, Volga 12.1%, Ural 11.0%, and the Central 8.8%. Two groups of districts stand out in terms of the average value of forest carbon sink: 1) with 0.64–0.85 t С ha-1 year-1 (the Central, the Southern, North Caucasian, Volga FDs), 2) with 0.11–0.33 t C ha-1 year-1 (the Northwestern, Ural, Siberian, the Far Eastern FDs). The magnitude of the carbon sink in the forests of the FDs was at its lowest in 1988–1993. The reduction of losses due to felling in 1993–2000 resulted in increased carbon sink in the majority of federal districts. According to the level of this increase the forests of FDs can be divided into 2 groups: 1) with a significant increase in carbon sink (by 86% and more) – the Northwestern, Ural, Siberian, the Far Eastern FDs; 2) with a moderate increase in carbon sink (by 4–46%) in the Central, the Southern, North Caucasian and Volga FDs.
Key words: federal districts, forests, carbon pool, carbon absorption, carbon balance, phytomass, dead wood, litter, soil, forest fires, felling
The assessment of the carbon cycle of Russian forests at different spatial levels has become an extremely popular line of research over the past two decades. There are many scientific publications on the results of experimental and field, data analytic, geoinformation, remote and model studies. At the same time, generalizations at the national level are still very vague and show a low goodness of fit (Zamolodchikov et al., 2013, 2017; Fedorov et al., 2011; Filipchuk et al., 2016, 2017; Shvidenko et al., 2014; Dolman et al., 2013, etc.). After the adoption of the Paris Agreement this situation led to an increased discussion on the role of forests in the formation of the national greenhouse gas budget in the context of feasibility of reducing greenhouse gas emissions in industrial economic sectors. Some of the debating parties argue that there’s no need for the Russian economy to reduce emissions since the Russian forests absorb more carbon than is emitted by the industry. It is only necessary to recognize this fact at the conference venues of the UN Framework Convention on Climate Change (UNFCCC) with possible introduction of the mechanisms of international compensations payment for carbon sink in Russia. According to the other position, anthropogenic emissions in Russia are higher than carbon absorption by its forests, so it is necessary to improve both the energy efficiency to reduce emissions and the management of national forests to increase carbon sink. Both points of view are corroborated by existing scientific publications.
The first point of view does not take into account the need to comply with a number of requirements when shaping national reporting on the greenhouse gas budget. These requirements are set out in the guidelines of the International Panel on Climate Change (IPCC) (Guidelines…, 2003). In particular, it notes that estimated carbon balance in the managed forests is derived from official forest inventory data using a very specific set of equations, the coefficients of which can be determined on the basis of the available national data. A significant part of regional and national assessments for Russian forests (Bobkova et al., 2015; Vaganov et al., 2005; Vedrova, 2011; Dolman et al., 2013) with respect to data generalization (eddy covariance etc.) is an extrapolation of a limited number of field studies to larger areas, which is inconsistent with the IPCC approach.
The RECBF system (Regional Evaluation of Carbon Budget of Forests) developed by the authors of this article (Zamolodchikov et al., 2011, 2013) is fully in line with the recommendations of the IPCC. This calculation system integrates the results of 2 decades of dwelling on forest-carbon issue in the Center for ecology and forest productivity of RAS, launched on the initiative of the member of the Academy of Sciences A. S. Isaev (Isaev et al., 1993, 1995; Zamolodchikov et al., 2003, 2005; Zamolodchikov, 2009; Chestnykh et al., 1999, 2004, 2007; Utkin et al., 2001, etc.). Since 2010 the RECBF has been used in the National Greenhouse Gas Emissions Inventory for reporting about the forestry sector (National report…, 2017 and earlier). As part of the National Inventory the RECBF system is regularly examined by the experts of the UNFCCC. These tests are successfully passed which confirms that the system is robust and complies with the IPCC approaches.
The previously published findings obtained with RECBF considered either the territory of entire Russia (Zamolodchikov et al., 2011, 2013a, 2013b, 2017) or its territorial entities and smaller territorial units (Zamolodchikov, Ivanov, 2016; Zamolodchikov et al., 2018). The objective of this paper is to describe the spatial variability of forest carbon budget at the level of federal districts (FDs). This level, on the one hand, is sufficient to identify regional features of the forest carbon cycle determined by both natural conditions and forest management aspects. On the other hand, the results obtained for the FDs can be sufficiently detailed for scientific generalizations, as opposed to a more detailed level for the territorial entities of the Russian Federation.
MATERIALS AND METHODS
The RECBF system implies using the State Forest Registry (SFR) entries as input data. The SFR was introduced by the Forest Code of the Russian Federation (Forest Code, 2007), replacing the previous system of the State Forest Fund Account (SFFA). Fortunately, methods underpinning the SFR and the SFFA do not differ much, which makes it possible to recover agreed data series needed to assess the dynamic pattern of the forest carbon budget. Our paper (Zamolodchikov et al., 2011) gives a detailed description of the procedures for constructing data series, of the particular characteristics of presenting accounting information associated with the change of authorities of forest management as well as the dynamic pattern of accounting categories of the forest fund. In this paper, we used the SFFA databases as of January 1, 1988, 1993, 1998-2006 and the SFR databases as of January 1, 2007–2015. Data on areas and growing stocks in different age groups of the dominating species for each entity of the Russian Federation were chosen from these databases. Besides, the information on the areas of clear cut areas, burnt areas and dead stands in each territorial entity of the Russian Federation was taken into account during calculations. The estimates given in this paper refer to the forested area of 785.58 million ha, which consists of 770.09 million ha of forests on forest fund lands (as of 01.01.2015) and 15.49 million ha of forests on protected areas. Since 2004, forests on protected areas have not been included in the databases of the SFFA and SFR, so they are assessed based on the information as of 01.01.2003.
The full set of RECBF equations and parameters can be found in the articles (Zamolodchikov et al., 2011, 2013b), so here only a brief summary of the approach is given. The initial part of the calculations is to estimate the carbon pool for different age groups of forest stands by predominant species. The calculation of the carbon storage in the pools of phytomass and dead wood is carried out based on the data on volume stocks of stem wood from the SFR or SFFA using sets of conversion factors from the works of (Zamolodchikov et al., 2003; Zamolodchikov, 2009). The calculation of the carbon storage in the pools of litter and soil is carried out based on the information about the areas of forest-forming species stands from the SFR or SFFA using standard average values from the works of (Chestnykh et al., 2004, 2007). The obtained estimation of the carbon pool in stand groups of different age makes it possible to calculate the gains for all carbon pools by using information about age ranges in the age groups.
By applying the data on annual areas of destructive disturbances (felling, forest fires, other reasons causing the death of forest stands) to the found carbon pools in different categories of the forest stands we can estimate the annual carbon losses. The annual scale of destruction can be estimated in two ways (Zamolodchikov et al., 2011, 2013b): 1) based on the size of burnt areas and clear cut areas taking into account the time of regeneration; 2) based on the current area covered by fire and scale of felling. The first method requires only the materials provided by the SFR or SFFA to obtain smoothed (aligned) estimates of carbon losses due to felling and fires. The second method calls for additional information, that is, data on the areas of clear cuts and fire-covered forested lands for each year of the assessment period. The resulting loss estimates have a large year to year variability due to the differing areas of forest fires. The estimates given in this paper are based on the first “smoothed” method of carbon loss calculation.
Uncertainties in the estimates are calculated based on standard errors of the equation parameters, i. e. conversion factors and standard values of carbon stored in litter and soil. Errors in estimated areas and wood resources selected from the SFFA and SFR databases are assumed equal to zero. When estimating the errors of calculation values standard error transformation rules were used.
RESULTS AND DISCUSSION
Federal districts in Russia were introduced in 2000 and experienced some changes, for example, the separation of the North Caucasian FD from the Southern FD in 2010, the establishment of the Crimean FD in 2014 and its abolition in 2016. In this chapter we use the division into federal districts for the period before 2000, and the territorial entities of the Russian Federation are assignment to a particular FD based on their distribution in 2018. The forests of the Crimean Peninsula are not considered in this article due to the lack of information in the majority of the SFFA and SFR databases.
The federal districts differ significantly both in total area (the Far Eastern FD is the largest one with 616.9 million ha, the North Caucasian FD is the smallest with 17.0 million ha) and in forest cover (maximum in the Siberian FD – 53.4%, minimum in the Southern FD – 3.5%). It is obvious that the contribution of the FDs to carbon pools and carbon balance will largely depend on the total area of forested land. In 2015, the Far Eastern FD had the largest forest area (292.67 million ha), the smallest area was in the Southern FD (1.58 million ha).
All FDs showed an increase in forested areas from 1988 to 2015 ranging from 1.1 (Siberian FD) to 5.7% (Northwestern FD). This growth is connected with the decrease of the forest fund areas that were temporarily not covered with forests, e.g. clear сut areas in the first place. In its turn, it is caused by more than 200% decrease of logging during the socio-economic reforms of the early 1990s (Zamolodchikov et al., 2011, 2013b). Even now the level of logging is still about 2 times lower than in the late 1980s. A modest increase in the areas of forested lands in the Siberian FD reveals the dire situation around forest fires in this district.
As of 01.01.2015, the total carbon pool of the forested lands of Russia amounted to 123.77±18.93 Gt C (billion tons of C). The Siberian (36.4%) and Far Eastern (35.2%) FDs made the largest contribution to the national carbon pool of the forests, containing 71.6% of the national carbon pool of the forests (Table 1). This makes sense if we think about huge forested areas in these districts. The Southern (0.2%) and North Caucasian (0.3%) FDs account for the smallest percentage of carbon pools in their forests.
The average carbon pool in the phytomass per unit area is the largest in the North Caucasian FD (85.05±9.66 t C ha-1) and the smallest in the Far Eastern FD (31.26±2.93 t C ha-1) (Fig. 1). Therefore the average carbon pool of phytomass shows almost a 3-fold variation across the districts, which is primarily due to differences in natural conditions. About 70% of the forest area in the North Caucasian FD is covered by mountain stands of hardwoods with large timber resources. Also, hardwoods have high wood density and therefore are more carbon-intensive given the same stands volume as compared to other groups of species.
Table 1. Carbon stocks of the forested lands of federal districts as of 01.01.2015
|
Federal district |
Area, 106 ha |
Carbon pool, Gt C |
||||
|
phytomass |
dead wood |
litter |
soil layer 0–30 cm thick |
total |
||
|
Central |
21.36 |
1.45±0.11 |
0.31±0.03 |
0.16±0.03 |
1.60±0.29 |
3.51±0.45 |
|
Northwestern |
87.64 |
3.79±0.25 |
0.91±0.07 |
1.25±0.21 |
8.07±1.24 |
14.02±1.77 |
|
Southern |
1.58 |
0.11±0.01 |
0.02±0.00 |
0.01±0.00 |
0.10±0.02 |
0.24±0.03 |
|
North Caucasian |
2.56 |
0.22±0.02 |
0.03±0.00 |
0.01±0.00 |
0.15±0.02 |
0.41±0.05 |
|
Volga |
36.77 |
2.09±0.16 |
0.47±0.04 |
0.35±0.06 |
2.51±0.48 |
5.42±0.74 |
|
Ural |
68.51 |
2.92±0.18 |
0.63±0.05 |
0.85±0.17 |
7.10±1.64 |
11.50±2.05 |
|
Siberian |
274.51 |
12.30±0.96 |
2.29±0.19 |
1.70±0.37 |
28.76±6.13 |
45.05±7.64 |
|
Far Eastern |
292.67 |
9.15±0.86 |
1.56±0.13 |
1.60±0.26 |
31.30±4.96 |
43.61±6.20 |
|
Russian Federation |
785.58 |
32.03±2.54 |
6.23±0.51 |
5.93±1.10 |
79.58±14.78 |
123.77±18.93 |
The maximum and minimum average ecosystem pools of forest carbon were found in Ural (167.92±29.92 t C ha-1) and Far Eastern (149.00±21.19 t C ha-1) FDs, these values only differ by 13%. Thus, carbon stocks in soil and other pools of dead organic matter offset the variations of phytomass carbon among the districts.
Before presenting the results related to the assessment of the carbon balance, let us clarify the terminology used. By carbon absorption we mean its annual growth in all the pools of the forest ecosystem (phytomass, dead wood, litter, and soil). These gains are the difference between natural flows of carbon replenishment and outflow from each pool. For example, for the phytomass pool, it is the difference between net primary production (NPP) and the tree mortality and litter fall, bringing carbon to the pools of dead wood and litter, respectively. For dead wood, this is the difference between the tree mortality (replenishment) and emission flows from the decomposition of dead wood and its transition to the soil pool (withdrawal). We emphasize that the current version of RECBF software does not give an opportunity to assess the entire set of carbon flows and is limited to the calculation of the increments in carbon pools only. Non-destructive disturbance of forest cover (low intensity ground fires, thinning, selection felling) cause a certain reduction in the volume of growing stocks, at the same time the disturbed areas remaining part of the forested land. Therefore, non-destructive disturbances affect the size of average stocks of stands in a particular forest region, so they are taken into account in the assessment of carbon absorption by RECBF.
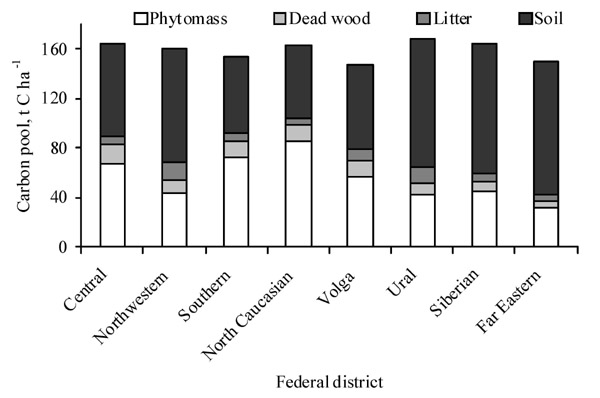
Figure 1. Average carbon pools in forested lands of the federal districts as of 01.01.2015
Destructive disturbances (clear cuts, crowning and ground fires of high intensity, windthrows, etc.) take the affected areas out of forested lands. Carbon pools in the disturbed lands usually greatly decrease due to the removal of harvested wood, direct fire emissions, withering away of affected trees, worsening of post-fire emissions etc. These flows are not taken into account when calculating the amount of absorption (carbon increments) on forest-covered land, and should therefore be subtracted from it when determining the carbon balance. The total balance can be either positive (absorption exceeds losses) or negative (absorption is smaller than losses). In the first situation, the term “sink” is used, in the second we are talking about a “source” of carbon.
The distribution of the total carbon pool of forests by districts largely corresponds to the areas covered with forest lands, the distribution of carbon sink values, however, demonstrates visible changes (Table 2). The total contribution of the Siberian and Far Eastern FDs to the national forest carbon sink (206.10±66.86 Mt C yr-1) is 54.5%, which is significantly less than 71.6% of their contribution to the carbon stock. At the same time, contributions of western FDs to the forest carbon sink are increasing and amount to 12.1% in the Volga district and 8.8% in the Central district, which is noticeably more than their contributions to of carbon pool (4.4% and 2.8%).
Table 2. Carbon balance of forested lands of the federal districts as of 01.01.2015
|
Federal district |
Area, 106 ha |
Carbon balance Mt C yr-1 |
||||
|
phytomass |
dead wood |
litter |
soil layer 0–30 cm thick |
total |
||
|
Central |
21.36 |
13.78±2.69 |
3.57±0.46 |
0.23±0.11 |
0.67±0.33 |
18.24±3.59 |
|
Northwestern |
87.64 |
20.40±4.61 |
1.84±1.03 |
1.10±0.52 |
2.15±1.05 |
25.50±7.21 |
|
Southern |
1.58 |
0.86±0.11 |
0.15±0.02 |
0.00±0.00 |
0.03±0.00 |
1.04±0.13 |
|
North Caucasian |
2.56 |
1.42±0.35 |
0.23±0.04 |
0.00±0.01 |
-0.03±0.03 |
1.63±0.42 |
|
Volga |
36.77 |
19.03±3.76 |
3.71±0.70 |
0.62±0.27 |
1.52±0.68 |
24.88±5.41 |
|
Ural |
68.51 |
17.66±2.64 |
1.93±0.61 |
0.73±0.37 |
2.24±1.16 |
22.57±4.77 |
|
Siberian |
274.51 |
56.30±11.98 |
4.67±1.89 |
2.59±1.40 |
17.53±6.53 |
81.09±21.80 |
|
Far Eastern |
292.67 |
21.17±12.91 |
2.33±1.70 |
1.02±1.31 |
6.64±7.60 |
31.16±23.53 |
|
Russian Federation |
785.58 |
150.62±39.04 |
18.44±6.45 |
6.29±3.99 |
30.75±17.38 |
206.10±66.86 |
Average values of carbon sink in forests per area unit vary by almost 9 times (Fig. 2): from 0.11±0.08 t C ha-1 year-1 (Far Eastern FD) to 0.85±0.17 t C ha -1 year -1 (Central FD). Based on the average value of carbon sink in forests, the districts are divided into two groups: 1) with a sink value of 0.64–0.85 t C ha-1 year-1 (the Central, the Southern, North Caucasian, Volga), 2) with a sink value of 0.11–0.33 t C ha-1 year-1 (the Northwestern, Ural, Siberian, the Far Eastern). There are several reasons for the differences between these groups. First, in southern districts the climate is favourable and the growth rate of young forests is high, contributing to carbon absorption. Second, in southern FDs forests face worse man-made destruction, meaning that the age structure has an increased share of young plants with large annual carbon increments. Third, in the FDs of the Asian part of Russia, as compared to the European districts, the impact of forest fires is much stronger due to the national features of forest fire protection (Lupyan et al., 2017). It is fires that are the main cause of high carbon losses in the forests of Siberian and the Far Eastern FDs, which are characterized by the lowest values of carbon sink.
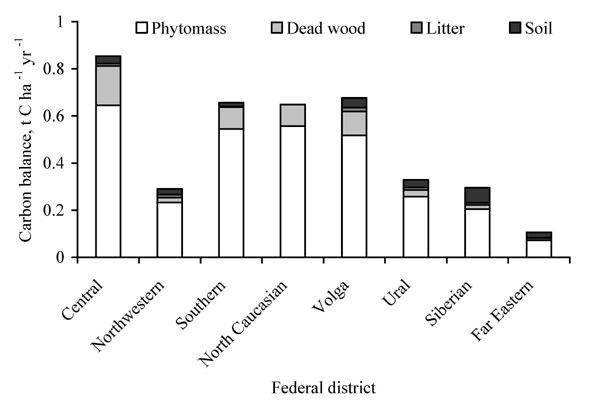
Figure 2. Average values of carbon sink of the forested lands of the federal districts as of 01.01.2015
When considering the dynamic pattern of carbon flows for 1988–2015, it was found that all districts show relative consistency of absorption values during the period of interest: the difference between the maximum and minimum absorption values varied from 5.9% (Volga FD) to 20% (Siberian FD) (Fig. 3). At the same time, carbon absorption in 5 FDs (the Northwestern, the Southern, Ural, Siberian, the Far Eastern) increased by 11.8–17.0% during the period from 1988 to 2015 while in 3 FDs (the Central, North Caucasian, Volga) it decreased by 0.5–9.3% during the same period. Absorption changes are controlled, on the one hand, by an area increase of forested land, and on the other hand, by a change in the age structure of forests associated with an increased proportion of older stands. In 1988–2000, the first trend prevailed (the area of forested land was increasing) therefore maximum values of absorption were seen in 2002–2008, and in 2003 for Russia as a whole. After 2008, there has been a trend towards reduced absorption due to changes in the age structure of forests. It should be said that the uncertainties of the estimates (they are not shown in Fig. 3 and subsequent figures to simplify the perception of figures) are 10–13% of the estimated value because the vast majority of year to year changes in carbon absorption by district forests cannot be considered as statistically significant.
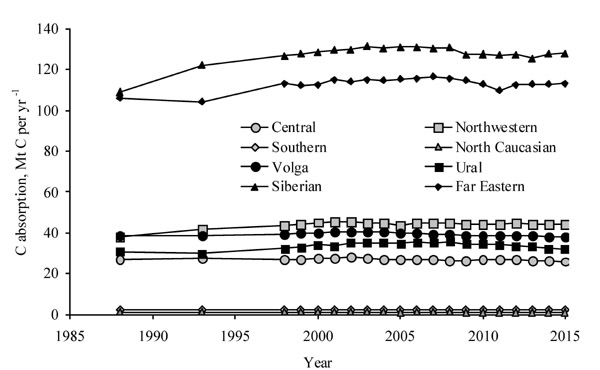
Figure 3. Dynamic pattern of carbon absorption by forested lands of federal districts
The changes in the values of carbon losses over the years 1988–2015 are more pronounced than those of absorption. All FDs showed a reduction of carbon losses due to clear cuts in 1993–2000 (Fig. 4A). This decline is caused by logging drop during the socio-economic reforms of the early 1990s. The relationship between this trend and the increase in carbon sink in the Russian forests was repeatedly discussed in our previous papers (Zamolodchikov et al., 2011, 2013a, 2013b, 2017). The development of remote forests requires significant costs for the construction of logging roads and transportation of wood. In the non-market economy of the Soviet Union, these costs were financed from the state budget. Transition to a market economy made it necessary to consider costs and profits, therefore the development of logging on a large part of the area of operational forests became unprofitable.
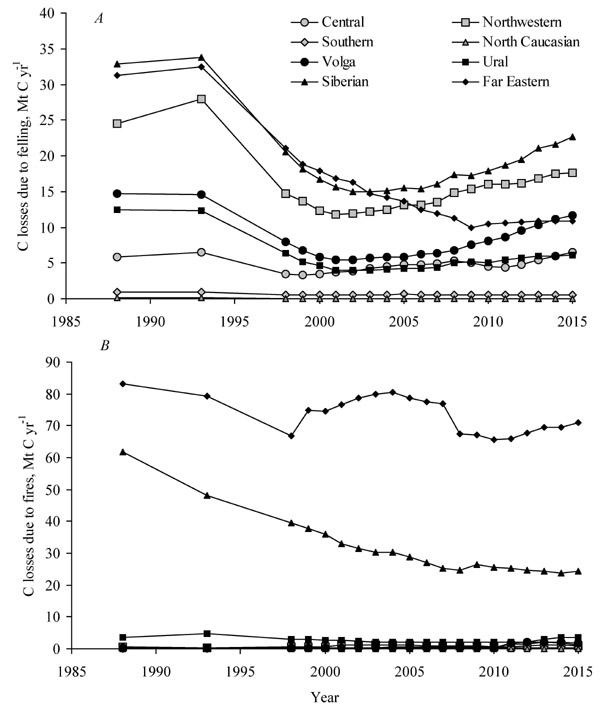
Figure 4. Dynamic pattern of carbon losses on the forested lands of the federal districts at clear cuts (A) and destructive forest fires (B)
In this paper, carbon losses due to felling are estimated based on the areas of felling taking into account the time needed for regeneration. Information on the volume of logging is of great economic importance and it is collected during statistical surveys of forestry. It must be emphasized that the indication of the area of felling in the SFR materials and the volume of harvested wood in state statistical forms are independent lines of information, therefore data on the volume of logging can be used to qualitatively check the values of felling-determined carbon losses calculated in RECBF. Fig. 5 demonstrates the dynamic pattern of the volume of harvested wood in the forests currently located on the territory of the relevant FDs, which was compiled using the forms of statistical survey of forestry from the information archives of the Center for Forest Ecology and Productivity of the RAS. In 1988 to 1998 the volume of logging decreased by 2–4 times in all the districts, in Russia in general it decreased by about 3 times. We can see that the dynamic pattern of carbon losses due to felling (Fig. 4A) is falling behind by about 3 years as compared to the volume of logging (Fig. 5). This delay is perfectly understandable as it takes some time to make changes to the regional forms of SFR and further reflect it at the national level.
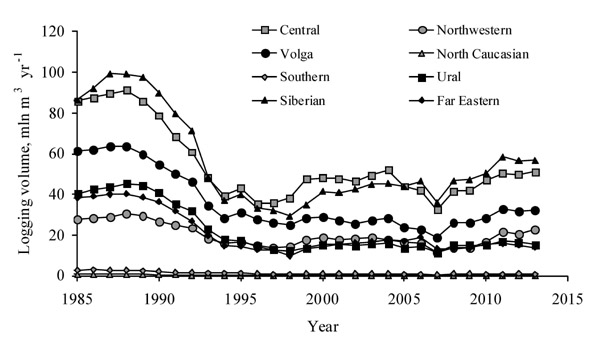
Figure 5. Dynamic pattern of the volume of harvested wood on the lands of the forest fund of Russia according to statistical surveys of forestry
The relations between the districts in terms of harvesting volumes and estimates of carbon losses due to felling are similar: these values are the largest in the Siberian FD and the smallest in the Southern and North Caucasian FDs. However, there is one exception. According to RECBF estimates, carbon losses due to felling in the Far Eastern FD in 1988–2003 were close to that of the Siberian FD (Fig. 4A), while the volume of logging lied between Volga and the Central districts (Fig. 5). The time of regeneration of cut areas in the Far Eastern FD was possibly overestimated in RECBF, which lead to an overestimation of losses due to felling. Also, due to the large areas of low accessible forests in the Far Eastern FD, information about the areas of felling and restoration of their forest cover may be updated quite slowly, which leads to an overestimation of the areas of felling in the SFR.
Losses from fires are high in two districts —Siberian and the Far Eastern — and they are 2.0–2.5 times higher than the loss due to felling in these FDs (Fig. 4B). In other districts, carbon loss due to fires is small compared to the loss due to felling. As was noted above, it is associated with the national features of forest fire protection. In Siberian FD fire losses do not show a pronounced temporal variability, while in the Far Eastern FD there is a decrease in these losses by about 2 times from 1988 to 2005. Unfortunately, these trends are difficult to compare with actual data on forest burning. Official forest fire statistics have been available since the mid-1950s, but they do not cover much of the forest area. In Soviet times, these areas were called “unguarded part of the forest Fund”, now they are “forest fires control zones” (Order…, 2015). The development of remote monitoring methods for forest fires revealed multiple discrepancies between statistical data and independent estimates of the forest area covered by fire (Lupyan et al., 2017; Shvidenko, Schepashchenko, 2013; Soja et al., 2004, etc.). Satellite forest assessments cover mainly the period from the early 2000s, which, taking into account high temporal and spatial variability of forest fires, is not sufficient for the analysis of long-term regional trends determined by changes in the organization of forest protection and climatic variations.
Forests in most of the districts were atmospheric carbon sinks throughout the time period under review (Fig. 6). The forests of the Far Eastern district turned out to be a carbon source for the atmosphere with 7–8 Mt C in 1988 and 1993. This occurs when gains do not compensate for losses. In this case, there is a possibility of calculated overestimation of carbon losses due to felling, as was mentioned above. The reduction in felling losses in the 1990s led to an increased carbon sink in the majority of the federal districts. By the nature of changes in carbon sink into forests, the FDs can be divided into 2 groups. The first group consists of the districts with a significant increase in carbon sink (86% and above). It is the Northwestern, Ural, Siberian, and the Far Eastern FDs with the reversed balance sign. All these districts are characterized by high forest cover and relatively low population density. The reduction of logging and the concomitant rise of the carbon sink were therefore very significant. The second group includes the districts with a moderate increase in carbon sink (4–46%). This includes the Central, the Southern, North Caucasian and Volga FDs. These districts show fairly high population density and denser road network which makes it possible to develop any forests without significant costs. Therefore, the loss of carbon during felling decreased less than in the first group of FDs.
Since early 1990s, a large number of Russian works have been published considering the carbon budget items of forest areas. The most popular spatial levels considered are the forests of the territorial entities of the Russian Federation (Zamolodchikov et al., 2018; Sopiga, Bogoslovskaya, 2011; Safonov et al., 2016; Tulokhonov et al., 2006; Usoltsev et al., 2008, etc.) and Russia in general (Zamolodchikov et al., 2013b, 2017; Fedorov et al., 2011; Filipchuk et al., 2016, 2017; Shvidenko, Shchepashchenko, 2014, etc.). The intermediate spatial level of the federal districts was largely overlooked, probably due to the relatively low impact on forestry of administrative structures at this level compared to federal and regional authorities. The exception is a series of papers on forest carbon of Ural FD published by the team under the supervision of V. A. Usoltsev (Usoltsev et al., 2005, 2006, 2008). According to these papers, the carbon pool in the phytomass of forests of the Ural FD is 2.68 Gt C for an area of 62.29 mln ha (43.0 t C ha-1). Our estimation is 2.92±0.18 Gt C for an area of 68.51 million ha (42.6±2.7 t C ha-1). Average values of phytomass carbon unit area are quantitatively similar and confirm the trend (which has been observed since 1990s) toward the convergence of estimates of forest carbon pools by different authoring teams. Unfortunately, it is not possible to compare estimated carbon flows with the data from this series of works. When talking about the “annual deposition of carbon in the phytomass”, V. A. Usoltsev et al. mean net primary production (NPP), which is estimated at 164.8 Mt C yr-1. The findings of this study, i. e. the estimated carbon absorption (32.2±3.9 Mt C yr-1) and balance (22.6±4.8 Mt C yr-1) in the forests of the Ural FD correspond to the terms “net ecosystem products” (NEP) and “clean biome products” (NBP), respectively.
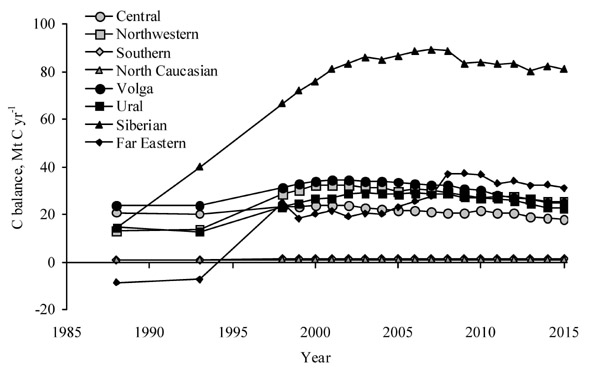
Figure 6. Dynamic pattern of the carbon balance in the forested lands of the Federal districts
In the introduction we have already mentioned the national discussion related to the registration of forest absorptive capacity in the Paris agreement. Some publications in the media noted that the method adopted in the National Greenhouse Gas Inventory (that is, RECBF) results in an underestimation of carbon absorption by the Russian forests, therefore the Russian forests absorb less carbon than the foreign ones (Tikhomirova, 2017). The materials of this article show, however, that the Russian forests are diverse in terms of their involvement in the carbon cycle, which is clearly evident at the level of FDs. Let’s compare (Fig. 7) the average carbon sink into the forests of the Russian FDs (per area unit) and that of a number of developed countries according to their reporting to the bodies of the UNFCCC (National Inventory Submissions, 2017). Among all the compared territories, the average carbon sink is maximal in the forests of the Central FD (0.85 t C ha-1 year-1), then approximately on par are the forests of the USA, Norway and Volga FD (0.68–0.72 t C ha-1 year-1), followed by Sweden, Ukraine and Belarus (0.44–0.55 t C ha-1 year-1), Finland, Ural and Siberian FDs (0.30–0.35 t C ha-1 year-1), Canada and the Far Eastern FD (0.11–0.20 t C ha-1 year-1). This comparison shows that there is no reason to talk about any underestimation of the absorptive capacity of Russian forests in comparison with other countries, and the existing differences between foreign countries and the federal districts of Russia are quite understandable if we take into account natural conditions and the history of the forest management of the compared territories.
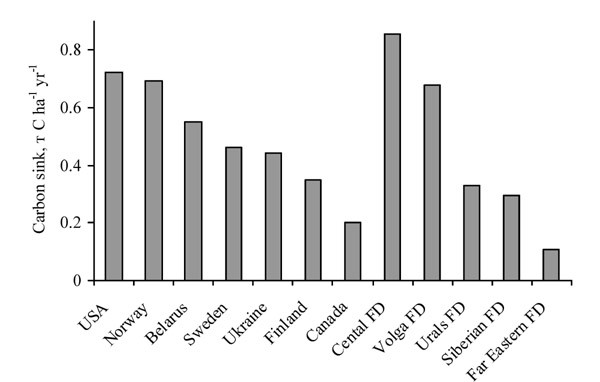
Figure 7. Comparison of the average values of carbon sink in the forests of a number of developed countries according to the reporting to the UNFCCC and some Federal districts of Russia
CONCLUSION
Forests of the federal districts of the Russian Federation differ in their ability to absorb atmospheric carbon, which is due to natural and climatic characteristics (forests in the North grow slower and absorb less carbon), features of forest fire protection (in the Asian part of Russia fire protection is less effective, therefore more carbon loss from fires) and biological properties of wood species. Consideration of these factors is necessary to achieve the optimal balance between using forests as suppliers of valuable raw material, i. e. wood, and using them as a sink of greenhouse gases.
The work is financed by the grant RNF (Russian Science Foundation) 16-17-00123 “Scientific basis of estimation and forecast of carbon budget of Russian forests in the system of international obligations for the protection of atmosphere and climate” (development of procedural guidelines) and the topic of the state task CEPF RAN No. 0110-2014-0002 “Climate-driven and anthropogenic modifications of biospheric functions of boreal forests and Arctic ecosystems of Russia” (data analysis).
REFERENCES
Bobkova K.S., Galenko E.P., Tuzhilkina V.V., Osipov A.F., Kuznetsov M.A. Rol’ boreal’nykh lesov Evropeiskogo Cevera Rossii v regulirovanii uglerodnogo balansa severnogo polushariya (Significance of the boreal forests of the European North of Russia in regulation of carbon balance of the northern hemisphere), Administrative aspects of development of northern territories of Russia. Proceedings of the All-Russian scientific conference (with the international participation). Syktyvkar: GOU VO KRAGSiU, 2015, part 3, pp. 36-41.
Chestnykh O.V., Zamolodchikov D.G., Utkin A.I., Korovin G.N. Raspredelenie zapasov organicheskogo ugleroda v pochvakh lesov Rossii (Distribution of reserves of organic carbon in soils of the forests of Russia), Lesovedenie, 1999, No 2, pp. 13-21.
Chestnykh O.V., Zamolodchikov D.G., Utkin A.I. Obshchie zapasy biologicheskogo ugleroda i azota v pochvakh lesnogo fonda Rossii (The general reserves of biological carbon and nitrogen in soils of forest fund of Russia), Lesovedenie, 2004, No 4, pp. 30-42.
Chestnykh O.V., Lyzhin V.A., Koksharova A.V. Zapasy ugleroda v podstilkakh lesov Rossii (Carbon reserves in litter of the woods of Russia), Lesovedenie, 2007, No 6, pp. 114-121.
Dolman A.J., Shvidenko A., Schepaschenko D., Ciais P., Tchebakova N., Chen T., van der Molen M. K., Belelli Marchesini L., Maximov T.C., Maksyutov S., Schulze E.-D. An estimate of the terrestrial carbon budget of Russia using inventory-based, eddy covariance and inversion method, Biogeosciences. 2012. V. 9. P. 5323–5340.
Fedorov B.G., Moiseev B.N., Sinyak Yu.V. Pogloshchayushchaya sposobnost’ lesov Rossii i vybrosy uglekislogo gaza energeticheskimi ob”ektami (The absorbing ability of the forests of Russia and emissions of carbon dioxide by power objects), Problemy prognozirovaniya, 2011, No 3, pp. 127-142.
Filipchuk A.N., Moiseev B.N., Malysheva N.V. Novye aspekty otsenki pogloshcheniya parnikovykh gazov lesami Rossii v kontekste Parizhskogo soglasheniya ob izmenenii klimata (New aspects of assessment of absorption of greenhouse gases the Russian forests in the context of the Paris agreement on climate change), Lesokhozyaistvennaya informatsiya, 2017, No 1, pp. 88-98.
Filipchuk A.N., Malysheva N.V., Moiseev B.N., Strakhov V.V. Analiticheskii obzor metodik ucheta vybrosov i pogloshcheniya lesami parnikovykh gazov iz atmosfery (The analytical review of techniques of accounting of emissions and absorption by the forests of greenhouse gases from the atmosphere), Lesokhozyaistvennaya informatsiya, 2016, No 3, pp. 36-85.
Isaev A.S., Korovin G.N., Sukhikh V.I., Titov S.P., Utkin A.I., Golub A.A., Zamolodchikov D.G., Pryazhnikov A.A. Ekologicheskie problemy pogloshcheniya uglekislogo gaza posredstvom lesovosstanovleniya i lesorazvedeniya v Rossii (Ecological problems of absorption of carbon dioxide by means of reforestation and afforestation in Russia.), M.: Tsentr ekologicheskoi politiki, 1995, 156 p.
Isaev A.S., Korovin G.N., Utkin A.I., Pryazhnikov A.A., Zamolodchikov D.G. Otsenka zapasov i godichnogo deponirovaniya ugleroda v fitomasse lesnykh ekosistem Rossii (Estimation of stocks and annual sequestration of carbon in the phytomass of forest ecosystems of Russia), Lesovedenie, 1993, No 5, pp. 3-10.
Lesnoi kodeks Rossiiskoi Federatsii (Forest code of the Russian Federation), M.: Eksmo, 2007, 92 p.
Lupyan E.A., Bartalev S.A., Balashov I.V., Egorov V.A., Ershov D.V., Kobets D.A., Sen’ko K.S., Stytsenko F.V., Sychugov I.G. Sputnikovyi monitoring lesnykh pozharov v 21 veke na territorii Rossiiskoi Federatsii (tsifry i fakty po dannym detektirovaniya aktivnogo goreniya) . Satellite monitoring of wildfires in the 21st century in the territory of the Russian Federation (figures and the facts according to detecting of active burning), Sovremennye problemy distantsionnogo zondirovaniya Zemli iz kosmosa, 2017, Vol. 14, No 6, pp. 158-175.
National Inventory Submissions 2017, available at: https://unfccc.int/process/transparency-and-reporting/reporting-and-review-under-the-convention/greenhouse-gas-inventories-annex-i-parties/submissions/national-inventory-submissions-2017, (2018, 31 August).
Natsional’nyi doklad o kadastre antropogennykh vybrosov iz istochnikov i absorbtsii poglotitelyami parnikovykh gazov ne reguliruemykh Monreal’skim protokolom za 1990 – 2016 gg (The national report on the inventory of anthropogenic emissions from sources and absorption by sinks of the greenhouse gases which aren’t regulated by the Montreal protocol for 1990 – 2016). Part 1, Moscow, 2018, 470 p.
Prikaz Ministerstva prirodnykh resursov i ekologii RF ot 8 oktyabrya 2015 g. No 426 «O vnesenii izmenenii v Pravila tusheniya lesnykh pozharov, utverzhdennye prikazom Minprirody Rossii ot 8 iyulya 2014 g. No 313». The order of the Ministry of Natural Resources and Ecology of the Russian Federation of October 8, 2015 No. 426 “About modification of the Rules of suppression of wildfires approved by the order of the Ministry of Natural Resources and Ecology of the Russian Federation of July 8, 2014 No. 313.
Rukovodyashchie ukazaniya po effektivnoi praktike dlya zemlepol’zovaniya, izmenenii v zemlepol’zovanii i lesnogo khozyaistva (Good practice Guidance for land use, land use change and forestry, Programma MGEIK po natsional’nym kadastram parnikovykh gazov. MGEIK, 2003.
Safonov G.V., Stetsenko A.V., Shishin M. Yu. Les i izmenenie klimata: regional’naya strategiya adaptatsii (na primere Altaya) (Forest and climate change: the regional strategy of adaptation (on the example of Altai)). M.: TEIS, 2016, 68 p.
Shvidenko A.Z., Shchepashchenko D.G. Klimaticheskie izmeneniya i lesnye pozhary v Rossii (Climatic changes and forest fires in Russia), Lesovedenie, 2013, No 5, pp. 50-61.
Shvidenko A.Z., Shchepashchenko D.G. Uglerodnyi byudzhet lesov Rossii (Carbon budget of the woods of Russia), Sibirskii lesnoi zhurnal, 2014, No 1, pp. 69-92.
Soja A.J., Sukhinin A., Cahoon Jr. D.R., Shugart H.H., Stackhous Jr. P.W. AVHRR-derived fire frequency, distribution, and area burned in Siberia, International Journal of Remote Sensing. 2004. V. 25. P. 1939-1951.
Sopiga V.A., Bogoslovskaya O.A. Deponirovanie ugleroda v fitomasse lesnogo pokrova Respubliki Komi (Carbon deposition in the phytomass of a forest cover of the Komi Republic), Aktual’nye problemy sovremennoi nauki, 2011, No 2 (58), pp. 176-178.
Tikhomirova Ya. Chem rossiiskie lesa khuzhe zarubezhnykh (Than the Russian forests is worse foreign), Gazeta.ru, 08.08.2017, available at: https://www.gazeta.ru/science/2017/08/07_a_10822279.shtml (2018, 31 August).
Tulokhonov A.K., Puntsukova S.D., Skulkina N.A., Kuznetsov Yu.A. Vklad lesov Buryatii v balans stoka i emissii ugleroda (Input of the forests of Buryatia in balance of a sink and emission of carbon), Geografiya i prirodnye resursy, 2006, No 2, pp. 41-48.
Usol’tsev V.A., Baranovskikh E.V., Maleev K.I. Deponirovanie ugleroda v fitomasse lesnogo pokrova Permskogo kraya (Carbon deposition in the phytomass of a forest cover of Perm Krai), Aktual’nye problemy lesnogo kompleksa, Vol. 21, Bryansk: BGITA, 2008, pp. 336-139.
Usol’tsev V.A., Zalesov S.V. Deponirovanie ugleroda v nasazhdeniyakh nekotorykh ekotonov i na lesopokrytykh ploshchadyakh Ural’skogo federal’nogo okruga (Carbon deposition in stands of some ecotones and on the forested areas of the Ural Federal District.), Ekaterinburg: UGLTU, 2005, 223 p.
Usol’tsev V.A., Terekhov G.G., Kanunnikova O.V. Deponirovanie ugleroda lesami Ural’skogo federal’nogo okruga (Carbon depostion by the forests of the Ural Federal District), Sibirskii ekologicheskii zhurnal, 2008, Vol. 15, No 3, pp. 371-380.
Usol’tsev, V.A., Sopiga V.A., Zalesov S.V., Bogoslovskaya O.A. Opredelenie i kartirovanie godichnogo deponirovaniya ugleroda na lesopokrytykh ploshchadyakh Ural’skogo federal’nogo okruga (Determination and mapping of annual carbon deposition on the forested areas of the Ural Federal District), Lesa Urala i khozyaistvo v nikh, Ekaterinburg: Ural. gos. lesotekhn. un-t, 2006, Vol. 27, pp. 230-257.
Utkin A.I., Zamolodchikov D.G., Chestnykh O.V., Korovin G.N., Zukert N.V. Lesa Rossii kak rezervuar organicheskogo ugleroda biosfery (Forests of Russia as reservoir of organic carbon of the biosphere), Lesovedenie, 2001, No 5, pp. 8-23.
Vaganov E.A., Vedrova E.F., Verkhovets S.V., Efremov S.P., Efremova T.T., Kruglov V.B., Onuchin A.A., Sukhinin A.I., Shibistova O.B. Lesa i bolota Sibiri v global’nom tsikle ugleroda (The forests and swamps of Siberia in a global cycle of carbon), Sibirskii ekologicheskii zhurnal, 2005, Vol. 12, No 4, pp. 631-650.
Vedrova E.F. Biogennye potoki ugleroda v boreal’nykh lesakh Tsentral’noi Sibiri (Biognig fluxes of carbon in the boreal forests of the Central Siberia), Izvestiya Rossiiskoi akademii nauk. Seriya biologicheskaya, 2011, No 1, pp. 77-89.
Zamolodchikov D.G. Otsenka pula ugleroda krupnykh drevesnykh ostatkov v lesakh Rossii s uchetom vliyaniya pozharov i rubok (Assessment of a pool of carbon of the coarse woody debris in the forests of Russia taking into account influence of the fires and fellings), Lesovedenie, 2009, No 4, pp. 3-15.
Zamolodchikov D.G., Grabovskii V.I., Korovin G.N., Gitarskii M.L., Blinov V.G., Dmitriev V.V., Kurts V.A. Byudzhet ugleroda upravlyaemykh lesov Rossiiskoi Federatsii v 1990-2050 gg.: retrospektivnaya otsenka i prognoz (The budget of carbon of the managed forests of the Russian Federation in 1990-2050: retrospective assessment and projection), Meteorologiya i gidrologiya, 2013a, No 10, pp. 73-92.
Zamolodchikov D.G., Grabovskii V.I., Kraev G.N. Dinamika byudzheta ugleroda lesov Rossii za dva poslednikh desyatiletiya (Dynamics of the carbon budget of the forests of Russia in two last decades), Lesovedenie, 2011, No 6, pp. 16-28.
Zamolodchikov D.G., Grabovskii V.I., Shulyak P.P., Chestnykh O.V. Vliyanie pozharov i zagotovok drevesiny na uglerodnyi balans lesov Rossii (Influence of the fires and fellings on carbon balance of the forests of Russia), Lesovedenie, 2013b, No 5, pp. 36-49.
Zamolodchikov D.G., Grabovskii V.I., Shulyak P.P., Chestnykh O.V. Sovremennoe sokrashchenie stoka ugleroda v lesa Rossii (Modern reduction of carbon sink to Russian forests), Doklady Akademii nauk, 2017, Vol. 476, No 6, pp. 719-721.
Zamolodchikov D.G., Ivanov A.V. Zapasy i potoki ugleroda v lesakh Ussuriiskogo lesnichestva soglasno otsenke po sisteme ROBUL (Stocks and flows of carbon in the forests of the Ussuriysk forest unit according to assessment on the ROBUL system), Agrarnyi vestnik Primor’ya, 2016, No 1, pp. 12-15.
Zamolodchikov D.G., Ivanov A.V., Mudrak V.P. Zapasy i potoki ugleroda na zemlyakh lesnogo fonda Primorskogo kraya pri otsenke po sisteme ROBUL (Stocks and flows of carbon on lands of forest fund of Primorsky Krai at assessment on the ROBUL system), Agrarnyi vestnik Primor’ya, 2018, No 2, pp. 46-51.
Zamolodchikov D.G., Korovin G.N., Utkin A.I., Chestnykh O.V., Songen B. Uglerod v lesnom fonde i sel’skokhozyaistvennykh ugod’yakh Rossii (Carbon in forest fund and agricultural lands of Russia), Moscow: KMK, 2005, 200 p.
Zamolodchikov D.G., Utkin A.I., Chestnykh O.V. Koeffitsienty konversii zapasov nasazhdenii v fitomassu osnovnykh lesoobrazuyushchikh porod Rossii (Coefficients of conversion of growing stocks in the phytomass of the main tree species of Russia), Lesnaya taksatsiya i lesoustroistvo, 2003, Issue 1(32), pp. 119-127.
Reviewer: DSc in geography, рrofessor Alekseev A.S.