- DOI 10.31509/2658-607x-2020-3-1-1-10
Possibility of assessing the renewal of forest vegetation after clear fellings using landsat satellite data (evidence from Bryansk polesie)
С текстом оригинальной статьи Вы можете ознакомиться по ссылке
![]()
Original Russian Text © 2019 E.I. Belova, D.V. Ershov, published in Forest Science Issues Vol. 2, No. 4, pp. 1-20
E.I. Belova*, D.V. Ershov
Center for Forest Ecology and Productivity of the RAS
Profsoyuznaya st. 84/32 bldg. 14, Moscow, 117997, Russia
E-mail: belova@ifi.rssi.ru
Received 23 September 2019
This paper considers remote sensing estimation of forest renewal in Suzemskoye forestry, Bryansk oblast. The objective was to study the possibility of assessing forest renewal on clear fellings through planting forest crops using the time series of vegetation indexes (NDVI and SWVI). The time series consists of cloud-free summer composite images based on Landsat data from 2002–2015. We used 2003 forest management plans and taxational descriptions of Kholmchenskoye forestry division which is part of Suzemskoye forestry as reference data. As a result, a linear relationship was obtained between the values of vegetation indexes, their time dynamics, and forest taxational characteristics (forest type, species composition, and age group). This enabled 80.1%-accurate detection of the forests regeneration if Steklyanskoye, Krasnoslobodskoye and Kokorevskoye forestry divisions, which are part of Suzemskoye forestry of Bryansk oblast. These forests were renewed after clear fellings. The results of this study can be used in practical forest management where the issue of monitoring reforestation and afforestation activities is highly relevant.
Key words: reforestation, time series, vegetation indexes, NDVI, SWVI
Modern forest management practices are based on the principles of sustainable forest management, which presuppose the availability of up-to-date operational knowledge about the forest condition. The forest management materials are the main source of data on forests. In the European part of the Russian Federation, forest management works are carried out every 10–15
years (Order of the Ministry of natural resources…, 2018). However, in the case of intensive forest management where the main anthropogenic load on forests as a natural resource is felling for harvesting wood, this interval of updating forest taxation materials may be too long.
In accordance with the Forest Code of the Russian Federation, such felling is allowed only with subsequent reforestation of these areas (Forest Code…, 2006). Forest renewal shall be effected by way of natural, artificial and combined forest recreation (Forest code…, 2006). According to the Rules of reforestation, the forest plots subjected to artificial or combined reforestation are usually considered forested land when forest plants reach the parameters of the dominant forest species in terms of age, number of trees, and height. For example, for the common pine, the age is 9 years (Order of the Ministry of Natural Resources…, 2016). In case of 15-years-long intervals of forest management fieldwork the data lose their relevance. Therefore, monitoring reforestation activities, both natural and through forest crops planting, as well as updating forest taxation materials and forest maps require an independent way of assessing the state of stands on clear fellings between forest management works.
Such a method can use remote data that are publicly available, e.g. Landsat data (NASA, USA) etc.
Currently, there is a huge number of studies looking into vegetation dynamics based on satellite data. Some major projects are Global Forest Change (GFC) (Hansen 2013) and The Global Land Analysis and Discovery (GLAD) (Potapov 2015). These projects use data from Landsat satellites with a medium spatial resolution equaling to 30 m to analyze the changes in vegetation cover. There is also a huge time-series data archive (for over 30 years).
These projects resulted in creating satellite thematic products that reflect forest area growth and reduction. Assessment accuracy of the above characteristics was 87% for reduction and 76% for growth of forest cover according to GFC, and over 90% according to GLAD products.
At the same time, these products also have a number of disadvantages:
-
GFC project has only the data on total increment as of 2012;
-
GLAD project has been implemented in Eastern Europe;
-
they are not related to the Russian forest management.
The first research attempts in this area were carried out by the authors of this article in 2014 for the forests of Krasnoyarsk krai (Belova et al., 2015). This article continues the research on the possibility of detecting the overgrowth of the felling areas by young trees in Krasnoyarsk krai. The main objective of this paper is to study the possibility of remote assessment of forest renewal in clear fellings through planting forest crops and creating an automated method based on the knowledge obtained. The results of the work are useful for the entire forestry practice in terms of improving the methods of state monitoring of forest reproduction.
MATERIALS AND METHODS
Region of study
The territory of Suzemskoye forestry located in the south-west of Bryansk region was selected as a test plot. This is the area of coniferous-deciduous (mixed) forests of the European part of the Russian Federation. As in the entire European part of Russia, forestry activity in the Suzemskyoe forestry is intensive. Reforestation is carried out mainly through planting forest crops. According to the data provided by the Russian Statistics Agency as of 2012, reforestation amounted to 3.453 ha, of which 3.138 ha were artificially restored. Pine and spruce are the species mostly planted in the fellings. Natural restoration of vegetation happens rarely here in contrast to the forests of the Western and Eastern Siberia. Pine, spruce, birch and oak, less often – black alder and aspen are the main forest-forming species of the test plot.
Kholmchenskoye forestry division, which is part of Suzemskoye forestry, was chosen for the study.
Baseline data
Ground reference data were used for the study, i.e. forest management plans and taxational descriptions of the selected district as of 2003.
Below are the main taxation characteristics that we used in our work: plot area, species composition, forest age and type.
Time series of summer cloud-free composite satellite images were used as remote data. Composite images were constructed based on Landsat-5/7/8 data for 2002–2015 (Belova et al., 2011). The time series is not continuous. No summer composite images for 2003, 2004, and 2012 were built due to the lack of the required amount of satellite data (images). Each composite image consists of three spectral bands, i.e. red (630–690 nm), near-infrared (770–900 nm), and mid-infrared (1.550–1.750 nm), spatial resolution is 30 m.
Methods
Using composite images for each year from the time series, we calculated the vegetation indexes NDVI (Normalized Difference Vegetation Index) and SWVI (Shortwave Vegetation Index) (1, 2):
NDVI = (NIR−RED)/(NIR+RED), (1)
SWVI=(NIR-SWIR)/(NIR+SWIR), (2)
where RED is the red spectral band (630–690 nm);
NIR is the near-infrared spectral band (770–990 nm); and
SWIR is the mid-infrared spectral channel (1.550–1.750 nm).
According to the forest management plan and taxational descriptions, plots with the following land categories were selected for the territory of Kholmchenskoye forestry division: closed forest crops of different age and composition; crops at the recovery stage (not yet closed at the time of taxation) of different composition and age, as well as felling sites of different time ranges. The plots with closed forest crops were divided into 3 classes according to the composition: spruce, pine, and deciduous trees. The class of deciduous trees included the plots with oak, aspen or birch.
For further work, the plots were filtered by area. The minimum area was assumed to be 1 ha, which corresponds to a 9-pixel image fragment. 800 plots were selected in total. The boundaries of the areas were vectorized. To exclude the influence of bordering pixels, the spectral brightness of which is formed not only from the brightness of the vegetation inside the plot, but also from the brightness of vegetation on its border, each plot was provided with a buffer zone inside, as large as one pixel (Fig. 1). All pixels of each plot, except for the buffer zone, were considered as a single spatial study object.
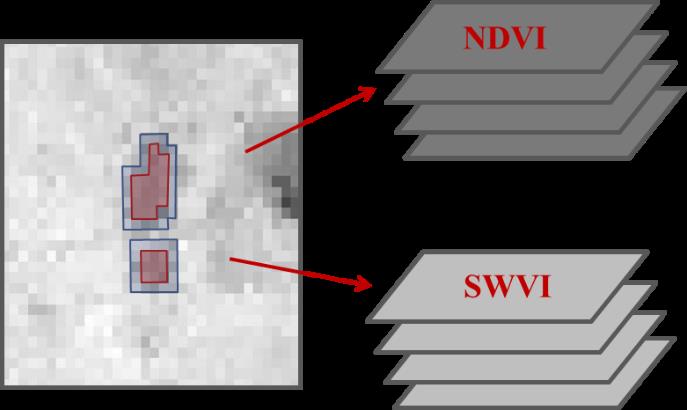
Figure 1. Example of a plot with a buffer zone inside
For each plot, average values of vegetation indexes for each year were calculated for each plot (3):
𝑀𝑥=(Σ1nxi)/n, (3), (3)
where x stands for the vegetation index value of the i pixel inside the plot;
n is the number of pixels in the plot; and
i is the pixel number in the plot.
Next, the accumulated average values of vegetation indexes for each year were determined for each plot (4). These values were placed in a two-dimensional SWVI–NDVI space to obtain a set of accumulated curves that characterize the state of vegetation in each plot.
Vгодi=Σi2002(Mx)i, i=2002, 2005, 2006…2015, (4)
where i is the year;
– average vegetation index value in the plot for the i-year.
For example, for 2007, the accumulated average values of vegetation indexes for the plot are as follows:
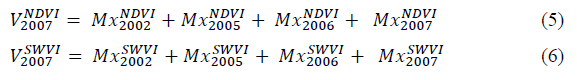
Figure 2 shows accumulated curves for nine plots.
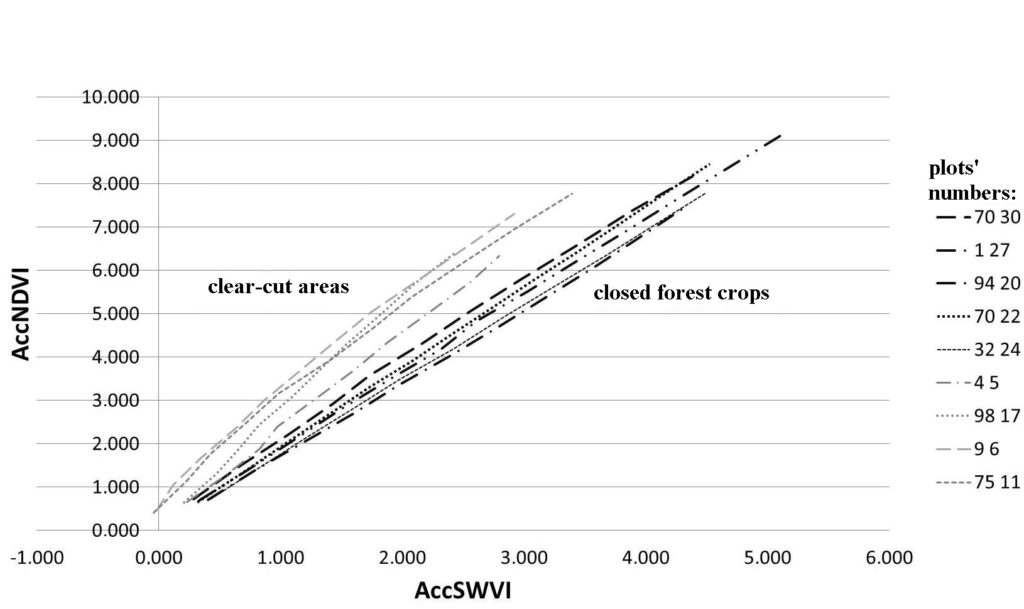
Figure 2. Accumulated average values of vegetation indexes for each year in the SWVI–NDVI two-dimensional space
RESULTS AND DISCUSSION
The relation of the accumulated values of vegetation indexes of forest crops in fellings is linear (Fig. 2), and the state of the vegetation on a plot can be characterized by the slope angle of the linear function: . The greater the angle of slope, the higher the probability that woody vegetation is either absent in the selection, or isn’t closed.
The restored links made it possible to calculate the threshold values of the slope angle for closed forest crops (without breaking down by breed composition). To do this, the following equation was solved:
Y = A × X + B, где B = 0, (7)
As a result:
A = 1.829, R2 = 0.976
CKO = 0.126,
As is seen from the graph (Fig. 3), most points belonging to the accumulated curves of the plots with closed forest crops lie within the interval . Thus, this interval which is the reference sector allows repeated determination of the state of vegetation on fellings where reforestation was carried out at any time using current data from the Landsat satellite.
Y = A × X, (8)
Y = (A + 2CKO) × X, (9)
Y = (A — 2CKO) × X, (10)
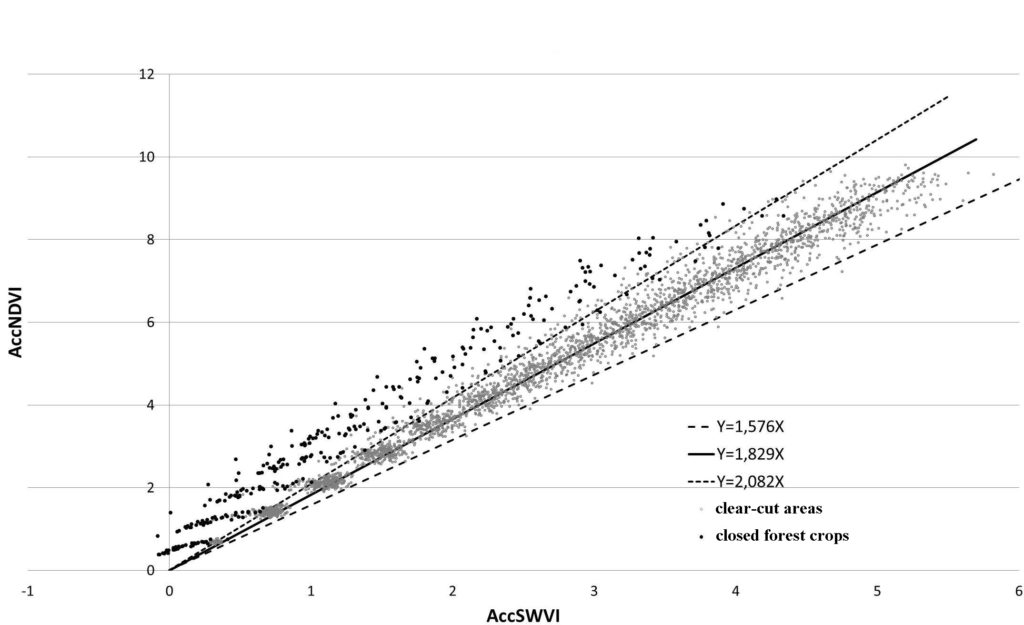
Figure 3. A set of accumulated curves (indicated by points) for all the plots of the test area
Studies have also shown that the slope angle of the linear function depends neither on the species composition of the stands, nor on the age of stands, nor the forest type (Fig. 4). The values of the linear regression coefficient A for different tree species are close, therefore the proposed method cannot be used to determine the species and the age of the restored forest crop.
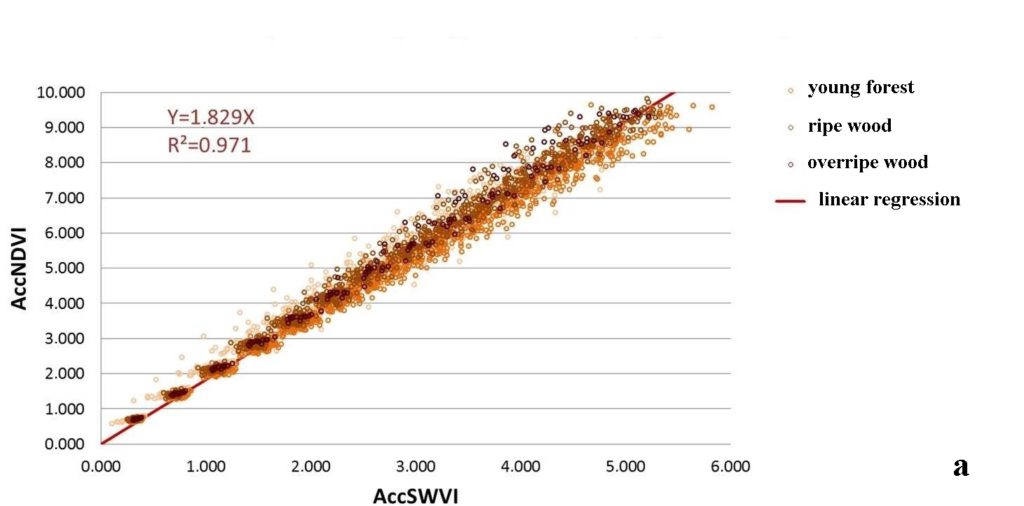
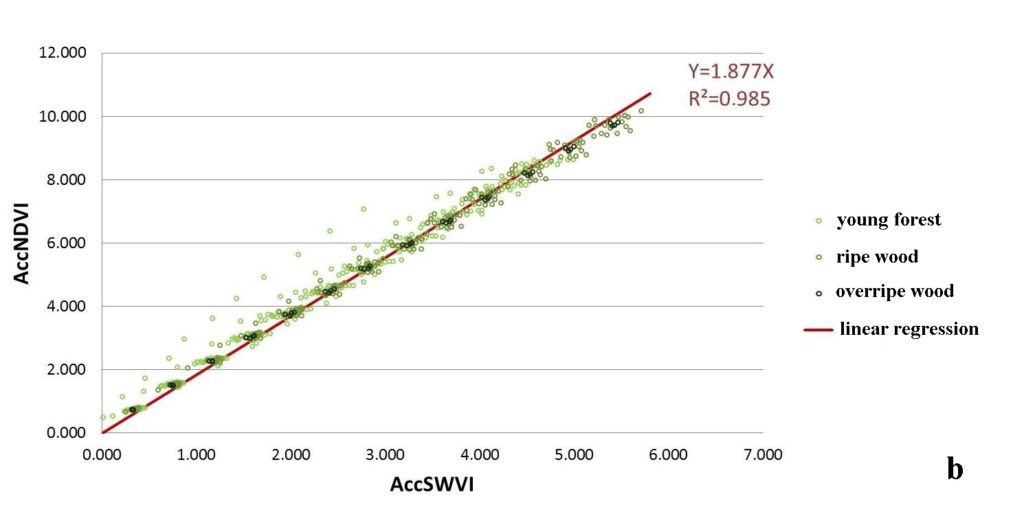

Figure 4. Set of accumulated curves (shown by points): a) closed pine crops by age groups; b) closed deciduous crops by age groups; c) closed spruce crops by age groups
Validation of the results obtained
Test plots of Steklyanskoye, Krasnoslobodskoye and Kokorevskoye forestry divisions (which are included into Suzemskoye forestry) were selected for the assessment of the method using the A coefficient threshold values that were based on the analysis of the vegetation indexes of plots of Kholmchenskoye forestry division.
Based on the forest taxation data of year 2003, 549 plots were selected, each being over 1 ha in size with closed crops of different age and composition, as well as with non-closed crops of different age and composition, which resulted from felling of different time ranges. Like in Kholmchenskoye forestry division, each plot here contained a buffer zone, excluded from the subsequent analysis, in order to eliminate the influence of the brightness of the plot’s border pixels.
Summer cloud-free composite images for years 2002–2015 were built for the territory of the forestry subdivisions. NDVI and SWVI vegetation indexes (1, 2) were calculated for the same period.
Using the formula (3), annual average values of vegetation indexes were calculated for each of the 549 plots. Then, accumulated curves were constructed for each plot using the formula (4).
Due to the absence of summer composite images in 2003 and 2004, the plots classification was carried out using satellite images made in 2005, as the closest year to the date of forest management materials. Based on the obtained threshold values of the linear regression coefficient of Kholmchenskoye forestry division, we classified 549 plots into the following classes: 1) closed crops of different species composition and age; 2) non-closed crops and fellings.
We compared the results of the classification with the taxational descriptions of these forestry divisions. The comparison results are shown in Table 1.
Table 1. Verification of classification results
|
Total number of plots |
549 |
|
|
Accurate classification |
440 |
80.1% |
|
Classification errors |
109 |
19.9% |
|
Of which the errors of: |
||
|
— kind 1 (missed target) |
82 |
75.2% |
|
— kind 2 (false alarm) |
27 |
24.8% |
Error analysis has shown that classification accuracy of the reforestation state depends on the plot area (Fig. 5), as the maximum number of errors occurred on the plots with an area under 2 ha. This is probably due to the spatial resolution of the Landsat satellite (30 meters or 0.09 ha), which generates images of plots, smaller than 2 ha with many mixed pixels at the forest – non-forest border. Using Sentinel-2 satellite images (10–20 m) might probably reduce the magnitude of error for reforestation sites, smaller than 2 ha.
Comparison of the obtained results with previous studies
The authors of the article carried out similar studies on the territory of Usolskoye and Chunskoye forestries of Krasnoyarsk krai (Belova et al., 2015), where natural forest restoration prevails in contrast to Suzemskoye forestry of Bryansk oblast. According to the data of the Federal State Agency for 2012, artificial restoration in Krasnoyarsk krai was observed on 7.217 ha, whereas natural restoration was observed on 49.832 ha.
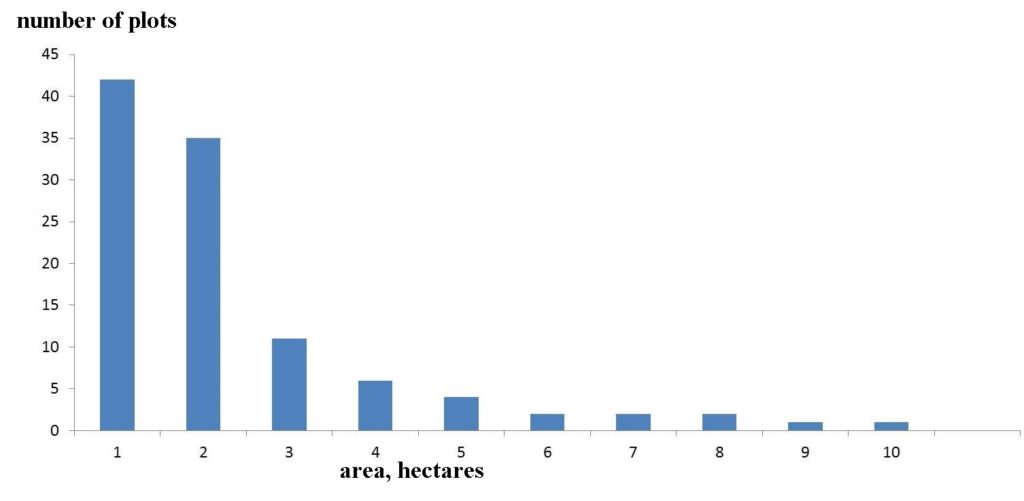
Figure 5. Distribution of classification errors by plot areas
As the graph (Fig. 6) shows, the range of values of the linear regression coefficient A for the reforestation sites in Krasnoyarsk krai is wider than for the test plots of Bryansk oblast. This may be due either to different forest growing conditions, or to differing species composition in these forests. Therefore, the linear regression coefficient A is variable and depends on the forest’s geographical location, the type of forest conditions, the species composition of stands, etc.
Also, our research in Krasnoyarsk krai has shown when validating the results that the main sources of classification errors were the plots subjected to reforestation activities. Most likely, this is due to the fact that the region is dominated by natural vegetation restoration on fellings, that is why forest crops containing plots were excluded from the sample when solving the linear regression equation.
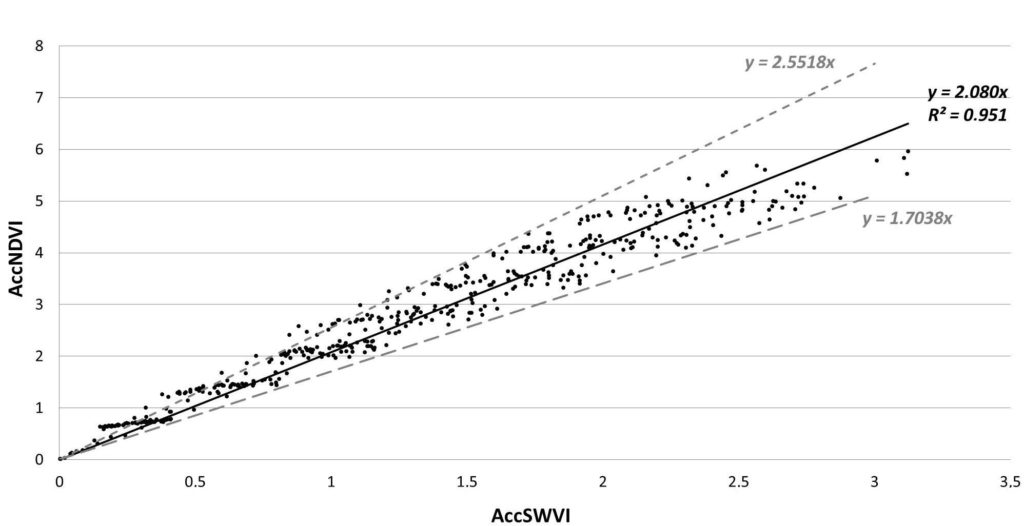
Figure 6. Accumulated curves for the forest that restored naturally in Krasnoyarsk krai
Thus, for each type of landscape or forest area, it is necessary to determine the reference values of the linear regression coefficient A using the taxation materials for the time series of satellite images. The adjusted regression model can then be repeatedly used to detect closed crops in the fellings when monitoring forest vegetation.
CONCLUSIONS
In the course of this research, forest management materials and a time series of Landsat cloud-free composite satellite images were studied and analyzed. The relationship was obtained between the dynamics of vegetation index values and the state of vegetation in clear fellings in the European part of Russia. This relationship characterizes the overgrowth of clear fellings during artificial reforestation.
The main conclusions drawn from this study:
1) this algorithm for analyzing the restoration dynamics of woody vegetation makes it possible to record the transition of the felling area from an unforested area to a forested one, both in case of natural and artificial restoration.
2) the obtained reference values of the coefficient of the linear regression model may be repeatedly used during detecting the closure of forest crops in certain forest growing conditions.
3) plots under 2 ha in size require other classification methods or satellite data with higher spatial resolution, since there’re over 70% of classification errors in case of Landsat model application.
4) this algorithm is not sensitive to the species and age composition of the stands. Using this method, it is possible to record the transition of the felling area from an unforested area to a forested area without the possibility of assessing the species-age structure of the stand.
ACKNOWLEDGEMENTS
The research was financed from a grant of the Russian Science Foundation (project No. 19-77-30015). The preparation and analysis of the thematic satellite images were carried out as part of research of the Center for Forest Ecology and Productivity of the RAS A18-118052590019-7).
REFERENCES
Belova E.I., Ershov D.V., Opyt ocenki estestvennogo lesovosstanovlenija na sploshnyh vyrubkah po vremennym rjadam LANDSAT (Assessing reforestation on clear cuts based on Landsat time series), Lesovedenie, 2015, Vol. 5, pp. 339-345.
Belova E.I., Ershov D.V., Predvaritel’naja obrabotka vremennyh serij izobrazhenij Landsat-TM/ETM+ pri sozdanii bezoblachnyh kompozitnyh izobrazhenij mestnosti (Preprocessing Landsat TM/ETM+ data sets for creating cloud-free composite imagery), Sovremennye problemy distancionnogo zondirovanija Zemli iz kosmosa, 2011, Vol. 8, No. 1, pp. 73-82.
http://www.consultant.ru/document/cons_doc_LAW_296757/77e0bc4c1b732cffc4ef23c2113effb964769f33/ (2019, 28 August)
http://www.consultant.ru/document/cons_doc_LAW_64299/710f2a2a776bb8cff9e204556177d7cb26f79dee/ (2019, 28 August)
http://www.consultant.ru/document/cons_doc_LAW_207285/4f0faeaf51f7cf71d1e928c355da9b3db3d3545d/ (2019, 28 August)
http://www.gks.ru/wps/wcm/connect/rosstat_main/rosstat/ru/statistics/environment/# (2019, 28 August)
Hansen M.C., Potapov P.V., Moore R., Turubanova S.A., Tyukavina A., Thau D., Stehman S.V., Goetz S.J., Loveland T R., Kommareddy A., Egorov A., Chini L., Justice C.O., Townshend J.R.G., High Resolution Global Maps of 21st Century Forest Cover Change, Science, 2013, Vol. 342, pp. 850-853.
Potapov P.V., Turubanova S.A., Tyukavina A., Krylov A.M., McCarty J L., Radeloff V. C., Hansen M.C, Eastern Europe’s forest cover dynamics from 1985 to 2012 quantified from the full Landsat archive, Remote Sensing of Environment, 2015, Vol. 159, pp. 28-43.
Reviewer: PhD in biology Medvedeva M.A.