- DOI 10.31509/2658-607x-202261-122
QUANTITATIVE ESTIMATES OF DIRECT PYROGENIC CARBON EMISSIONS IN FORESTS OF RUSSIA ACCORDING TO REMOTE MONITORING DATA 2021
![]()
Original Russian Text © 2022 D. V. Ershov, E. N. Sochilova published in Forest Science Issues Vol. 5, No. 4, Article 117
© 2023 D. V. Ershov*, E. N. Sochilova
Center for Forest Ecology and Productivity of the Russian Academy of Sciences
Profsoyuznaya st. 84/32 bldg. 14, Moscow, 117997, Russian Federation
*Email: dvershov67@gmail.com
Received: 28.11.2022
Revised: 15.12.2022
Accepted: 18.12.2022
This paper presents the statistics of direct wildfire carbon emission estimates during the wildfires of 2021 on forest lands of Russia using long-term satellite data. In 2021, the area affected by forest wildfires was 9.3 million ha, while carbon emissions amounted to 66.4 MtC. Said values are almost two points higher than the long-term average values. A comparison of similar indicators for twenty years allowed us to conclude that said year was anomalous with respect to the entire time series, similar to the wildfire seasons of 2003 and 2012. A period or interval for recurrence of three anomalous wildfire seasons is nine years. The reason for the recurrence of anomalous wildfire seasons is yet to be found. At the same time, the forest areas affected by wildfires, and direct carbon and other greenhouse gas emissions in anomalous wildfire years decreased from 127.2 MtC (3.7 times) in 2003 to 83.8 MtC (2.4 times) in 2012, and to 66.4 MtC (1.9 times) in 2021.
Keywords: wildfires, pyrogenic emissions, carbon, remote sensing, forest fuels
The task of estimating and monitoring yearly direct wildfire greenhouse gas emissions using remote sensing data from space is being solved by many research teams in Russia. The results and databases with long-term estimates of direct pyrogenic carbon emissions in the 21st century were published in a number of studies, in particular by A. Shvidenko and D. Schepaschenko (Shvidenko, Schepaschenko, 2013), V. Kharuk et al. (Kharuk et al., 2021), and E. Ponomarev et al. (Ponomarev et al., 2021). A. Shvidenko and D. Schepaschenko found that, for the period from 1998 to 2010, on average, the annual values of direct wildfire carbon emissions in Russia were 121 ± 28 MtC, of which 92 ± 18 MtC (2/3 of total emissions) were associated with wildfires on forest lands. V. Kharuk et al. (2021) presented an assessment of areas affected by wildfires in Central Siberia for the period from 1999 to 2019 according to remote sensing data. The authors state that 30% of all satellite data of wildfires detected in Central Siberia are detected on forested cover lands. The average long-term values of direct wildfire pyrogenic carbon emissions in the 21st century in Siberia are estimated at 85 ± 20 MtC per year.
Ponomarev et al. (2021) list even greater amounts of wildfire emissions in Central Siberia for the period of 2002–2020. According to them, average pyrogenic carbon emissions amounted to 80 ± 20 MtC/year in the first decade of the 21st century, and 110 ± 20 MtC/year in the second decade. At the same time, the authors note that in the anomalous fire seasons of 2003, 2012, and 2019, direct wildfire carbon emissions amounted to over 150 MtC/year, 220 MtC/year, and 180 MtC/year, respectively.
Each team used its own techniques to calculate pre-fire forest fuel reserves, models to determine wildfire type and intensity, and methods to estimate direct pyrogenic carbon emissions. For example, E. Ponomarev et al. (Ponomarev et al., 2021) used in their models the values of fire radiative power for each MODIS image pixel when calculating wildfire areas for wildfires of varying (low, medium, and high) degrees of intensity. Areas covered by wildfires were spatially tied to thematic classes of vegetation maps (VEGA-PRO, 2022); based on generalized data on forest fuel (FF) reserves collected from literature sources and ground measurements, total pre-fire FF reserves (in the range from 13.8 to 54.0 t/ha) for different types of woody vegetation were determined. Using empirical estimates, again collected from research papers, the authors defined the ranges of conversion rates and volumes of combustible FF in wildfires of various intensities. Thus, the authors cite the following ranges of biomass reserve consumption for major conductors of forest fuel combustion in low, medium, and high intensity wildfires: 1.1–9.7 t/ha, 8.6–21.5 t/ha, and 22.5–53.6 t/ha, respectively. These ranges are then used to quantify direct wildfire carbon emissions in Siberia.
The purpose of the study presented in this paper is to estimate direct pyrogenic carbon emissions 2021 based on the developed and tested methodology (Ershov et al., 2009), as well as analyze and compare the obtained estimates with long-term satellite monitoring over forest wildfires as well as direct pyrogenic emissions of carbon and other greenhouse gases (2002–2020).
MATERIALS AND METHODS
We used our methodology for assessing annual direct pyrogenic carbon emissions from wildfires for Russian forests at the national level. Carbon emission methodology on pixel level assessment of spatially distributed data (raster maps) on wildfires and pre-fire forest fuel reserves of low spatial resolution MODIS (230 m) is based. For each pixel with a thematic class of forest cover in the vegetation map of terrestrial ecosystems (Bartalev et al., 2016), FF reserves of the upper canopy, new growth, undergrowth, living ground cover, and forest litter (t/ha) were assessed according to the methodology (Sochilova et al., 2009). The obtained digital raster layers form the basis for a spatial framework of pre-fire forest fuel. The ranges of minimum and maximum FF reserves for forest classes on the vegetation map listed in Table 1 show comparable values provided by the article by E. I. Ponomarev et al. (2021) and by other authors (Vonskij, 1957; Kurbatskij, 1970; Sheshukov, 1970; Tsvetkov, 2001; Fedorov, Cykalov, 2002; Furjaev et al., 2007; Matveeva, 2008; Furjaev et al., 2009; Kovaleva et al., 2017). Some underestimations of the average biomass reserves of combustion conductors are probably because the calculations used the 2006 state forest accounting data and the corresponding conversion rates (Zamolodchikov et al., 2003), as well as the database on biomass and forest productivity at test plots, collected from study materials (Utkin et al., 1994). It may be necessary to update the databases and improve the calculation methods. Moreover, the calculation of the biomass FF reserves does not include data for logs and coarse woody debris, which could also affect the total reserves of combustion conductors. In upcoming our papers, significant changes will be made in the calculations of FF biomass reserves based on a number of models the authors published for the following layers: (1) tree biomass (Schepaschenko et al., 2018); (2) lower tree layers —undergrowth and forest shrubs; (3) living ground vegetation cover (Shvidenko et al., 2008); (4) coarse woody debris (Shvidenko et al., 2009); and (5) forest litter (Schepaschenko et al., 2013).
Pyrogenic carbon emissions in forests are determined based on data on the pre-fire reserves of main FF combustion conductors, as well as wildfire type and intensity (Ershov et al., 2016), corresponding consumed forest fuel reserves and corresponding volumes of carbon and greenhouse gases. Spatial wildfire data is generated every year and obtained from Datacenter IKI-Monitoring (Lupjan et al., 2019).
Table 1. Ranges of biomass reserves of main FF combustion conductors by types of vegetation maps of terrestrial ecosystems (Bartalev et al., 2016)
| № | Forest cover type | upper canopy (trees), t/ha |
undergrowth and forest shrubs,
t/ha |
living ground vegetation cover,
t/ha |
forest litter,
t/ha |
||||
| mean | ±sd | mean | ±sd | mean | ±sd | mean | ±sd | ||
| min-max | min-max | min-max | min-max | ||||||
| 1 | Dark coniferous evergreen forests | 12.60 | ±3.80 | 3.66 | ±0.74 | 4.55 | ±1.28 | 20.94 | ±6.79 |
| 4.36–48.95 | 0.18–7.61 | 0.10–10.45 | 4.20–31.40 | ||||||
| 2 | Light coniferous evergreen forests | 8.77 | ±3.77 | 1.45 | ±0.28 | 5.16 | ±1.75 | 20.06 | ±12.2 |
| 2.73–31.79 | 0.39–5.91 | 0.05–34.60 | 4.20–48.40 | ||||||
| 3 | Deciduous forests | 8.01 | ±3.00 | 2.85 | ±1.20 | 4.35 | ±1.51 | 9.54 | ±6.74 |
| 0.39–34.75 | 1.23–5.83 | 0.05–10.42 | 1.40–39.60 | ||||||
| 4 | Larch forests (incl. rare forest) | 4.11 | ±1.63 | 1.78 | ±0.20 | 4.38 | ±0.70 | 15.40 | ±4.13 |
| 1.05–12.80 | 0.99–2.80 | 0.23–9.39 | 11.00–33.00 | ||||||
| 5 | Mixed coniferous dominated forests | 9.96 | ±3.11 | 2.31 | ±0.54 | 4.47 | ±1.50 | 10.68 | ±4.55 |
| 0.85–33.99 | 0.94–5.52 | 0.05–23.55 | 5.22–22.76 | ||||||
| 6 | Mixed forests with equal participation of coniferous and deciduous tree species | 10.62 | ±3.06 | 2.24 | ±0.56 | 4.31 | ±1.41 | 12.60 | ±4.94 |
| 0.95–33.65 | 1.01–5.16 | 0.05–20.77 | 7.60–24.70 | ||||||
| 7 | Mixed deciduous dominated forests | 8.31 | ±2.40 | 2.30 | ±0.56 | 4.11 | ±1.50 | 10.00 | ±3.75 |
| 0.39–12.80 | 1.09–4.81 | 0.05–18.0 | 6.30–21.20 | ||||||
To determine the type and intensity of a forest wildfire, athematic raster product with forest tree condition damaged by wildfire (Stycenko et al., 2013) as well as forest classes of vegetation map (Bartalev et al., 2016) are used. Depending on the degree of damage to coniferous or deciduous forests in each pixel of the vegetation map, the wildfire type (crown fire or ground fire), as well as the degree of ground fire intensity are determined. The obtained raster product of the wildfire type and intensity to determine the proportion of consumed combustion conductor reserves for upper tree canopy, undergrowth, shrub, living ground vegetation cover, and forest litter is then used. At the final stage, the biomass reserves of all layers of FF vertical profile are combined into a common indicator. The total consumed biomass reserves are then reduced by half and converted to direct pyrogenic carbon emissions. To obtain the estimates of greenhouse gases, conversion rates are used that were published in the paper of D. Zamolodchikov et al. (Zamolodchikov et al., 2005).
RESULTS AND DISCUSSION
As a result of applying our methodology we determined the ranges (relative to average values) of the biomass FF consumption for various wildfire types and intensities during the fire season of 2021. The estimates obtained for biomass reserve consumption as a result of low, medium, and high intensity ground fires, as well as crown fires on the forested cover lands of Russia in 2021 range as follows: 0.05–5.46 t/ha (on average 1.62 ± 0.55 t/ha), 1.4–25.33 t/ha (on average 9.51 ± 1.97 t/ha), 0.3–43.25 t/ha (on average 14.37 ± 4.79 t/ha) and 12.20–66.32 t/ha (on average 24.62 ± 2.35 t/ha), respectively. The values of average biomass consumption of main FF combustion conductors are somewhat underestimated as compared with the literature sources cited in the introduction of this paper, as noted above, due to underestimation of pre-fire fuel reserves of the main FF combustion conductors. The scale of this underestimation has yet to be clarified using ground-based data on biomass reserves in forests and other terrestrial ecosystems, whose collection is supported by a research grant as part of development of a national system for monitoring over climatically active substances (Decree …, 2022).
We presented the estimated wildfire emissions over a long period of observations (2002–2021) at the scientific conference “Research Foundations of Sustainable Forest Management” (Ershov et al., 2022). According to the satellite monitoring data (2002–2021), the total area of forests affected by wildfires over 20 years amounted to 100.3 million ha, while direct carbon wildfire emissions amounted to 725.5 MtC (Table 2). For 2002–2020, the average area of forests affected by wildfires per year according to our estimates was 4.79 (±3.05) million ha/year, while direct pyrogenic carbon emissions amounted to 34.69 (±28.27) MtC/year.
The penultimate line of Table 2 shows the difference between the values of areas affected by forest wildfires, direct pyrogenic emissions of carbon and greenhouse gases in 2021, and average long-term values of the same indicators obtained for 2002–2020.
Table 2. Estimates of direct emissions of carbon and other greenhouse gases due to forest wildfires, obtained from 2002–2021 satellite monitoring across the Russian Federation
| Year | Carbon emissions, tCO2e | Area covered by forest wildfires, ha | Specific carbon emissions, t/ha | Greenhouse gas emissions, t | ||||
| CO2 | CO | CH4 | N2O | NOx | ||||
| 1 | 2 | 3 | 4 | 5 | 6 | 7 | 8 | 9 |
| 2002 | 21 692 800 | 4 671 712 | 4.64 | 79 540 267 | 3 036 992 | 347 085 | 2386 | 86 244 |
| 2003 | 127 116 214 | 12 025 093 | 10.57 | 466 092 785 | 17 796 270 | 2 033 859 | 13 983 | 505 378 |
| 2004 | 13 941 921 | 1 224 070 | 11.39 | 51 120 377 | 1 951 869 | 223 071 | 1534 | 55 429 |
| 2005 | 20 990 370 | 1 328 394 | 15.8 | 76 964 690 | 2 938 652 | 335 846 | 2309 | 83 452 |
| 2006 | 22 158 988 | 3 657 062 | 6.06 | 81 249 623 | 3 102 258 | 354 544 | 2437 | 88 098 |
| 2007 | 2 831 700 | 974 423 | 2.91 | 10 382 900 | 396 438 | 45 307 | 311 | 11 258 |
| 2008 | 26 560 308 | 6 832 945 | 3.89 | 97 387 796 | 3 718 443 | 424 965 | 2922 | 105 596 |
| 2009 | 12 046 092 | 2 739 083 | 4.4 | 44 169 004 | 1 686 453 | 192 737 | 1325 | 47 892 |
| 2010 | 15 321 461 | 2 107 599 | 7.27 | 56 178 690 | 2 145 005 | 245 143 | 1685 | 60 914 |
| 2011 | 26 770 414 | 3 850 295 | 6.95 | 98 158 185 | 3 747 858 | 428 327 | 2945 | 106 432 |
| 2012 | 83 821 145 | 11 365 539 | 7.38 | 307 344 198 | 11 734 960 | 1 341 138 | 9220 | 333 249 |
| 2013 | 28 093 793 | 3 420 556 | 8.21 | 103 010 574 | 3 933 131 | 449 501 | 3090 | 111 693 |
| 2014 | 35 882 796 | 4 441 315 | 8.08 | 131 570 251 | 5 023 591 | 574 125 | 3947 | 142 660 |
| 2015 | 20 413 097 | 3 691 087 | 5.53 | 74 848 024 | 2 857 834 | 326 610 | 2245 | 81 157 |
| 2016 | 37 188 902 | 6 341 329 | 5.86 | 136 359 307 | 5 206 446 | 595 022 | 4091 | 147 852 |
| 2017 | 40 089 468 | 3 334 361 | 12.02 | 146 994 716 | 5 612 526 | 641 431 | 4410 | 159 384 |
| 2018 | 43 339 633 | 6 622 768 | 6.54 | 158 911 988 | 6 067 549 | 693 434 | 4767 | 172 306 |
| 2019 | 44 213 928 | 5 904 418 | 7.49 | 162 117 736 | 6 189 950 | 707 423 | 4864 | 175 782 |
| 2020 | 36 603 092 | 6 465 819 | 5.66 | 134 211 337 | 5 124 433 | 585 649 | 4026 | 145 523 |
| Total
2002–2020 |
659 076 122 | 90 997 868 | 7.24 | 2 416 612 448 | 92 270 657 | 10 545 218 | 72 497 | 2 620 300 |
| Average multi-year value | 34 688 216.95 | 4 789 361.5 | 7.4 | 127 190 128.8 | 4 856 350.4 | 555 011.5 | 3815.6 | 137 910.5 |
| Standard deviation | 28 270 109.0 | 3 052 654.9 | 3.2 | 103 657 066.2 | 3 957 815.2 | 452 321.6 | 3109.8 | 112 393.9 |
| 2021 | 66 441 800 | 9 298 508 | 7.15 | 243 619 933 | 9 301 852 | 1 063 069 | 7309 | 264 154 |
| Multi-year mean relative | +31 753 583.1 | +4 509 146.5 | –0.25 | +116 429 804.5 | +4 445 501.6 | +508 057.3 | +3493.0 | +126 243.1 |
| Total
2002–2021 |
725 517 922 | 100 296 376 | 7.23 | 2 660 232 381 | 101 572 509 | 11 608 287 | 79 806 | 2 884 453 |
All indicators, except for specific carbon emissions (column 4), exceed the average long-term values, while the order of numbers is commensurate with the average long-term values. Emissions of carbon and other greenhouse gases in 2021 exceeded the average long-term values by 1.9 times, similar to 2003 (3.7 times) and 2012 (2.4 times). Thus, 2021 can be considered an anomalous year in terms of direct carbon emissions from wildfires, similar to the fire- seasons of 2012 and 2003 (Fig. 1).
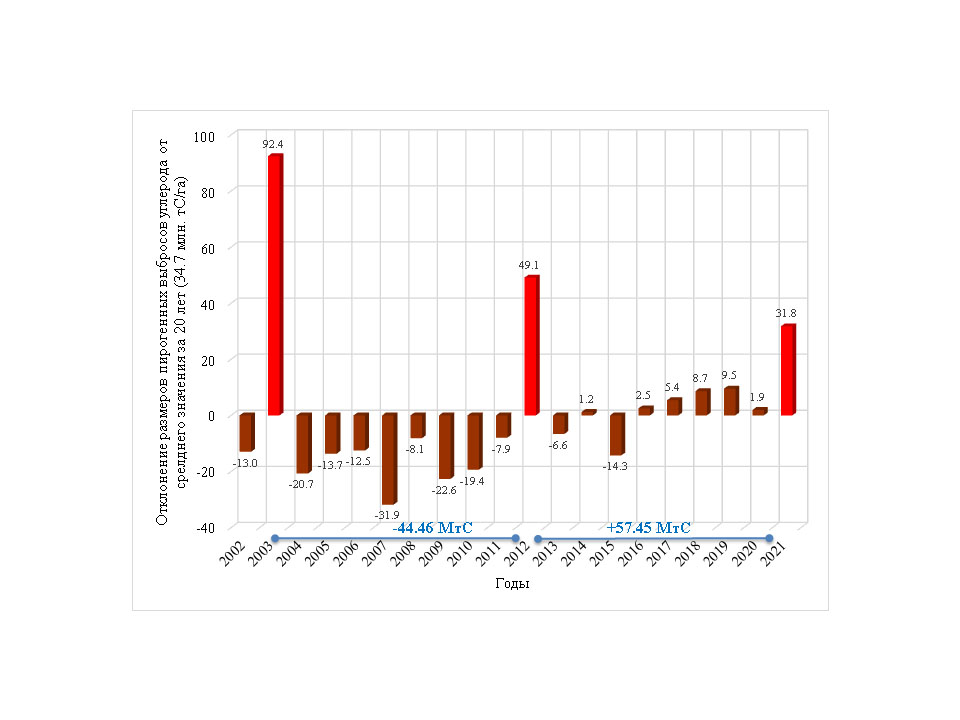
Figure 1. Deviation in values of direct pyrogenic carbon emissions relative to the average long-term values from 2002 to 2020. The blue lines indicate the intervals between anomalous years in increments of 9 years, and the numbers indicate the amount and sign of carbon emissions relative to the average long-term values for 19 years
The diagram (Fig. 1) shows three distinguished anomalous years that exceed the total values of pyrogenic carbon emissions relative to the average long-term values by 92.4, 49.1, and 31.8 MtC. The time interval in between is 9 years. In our paper (Ershov, Sochilova, 2020), we noted that, when analyzing the time interval series of 2002 to 2020, two anomalous years were found with 9-years interval in between. We suggested that 2021 might turn out to be anomalous as well if the identified cyclic recurrence exists in the territory of Russia. The reason for such cyclic recurrence in Russia has not yet been established and needs more research. We can only state that direct pyrogenic carbon emissions in anomalous years decreased over 20 years from 127.1 MtC (2003) to 83.8 MtC (2012), and to 66.4 MtC in 2021. Presumably, this is due to the fact that there was a systematic excess of pyrogenic carbon emissions relative to the long-term average value from 2016 to 2020, and the total value of emission exceedances for 2012–2020 has a positive sign, i. e. 57.45 MtC (Fig. 1). Thus, as wildfire intensity increases from year to year, the yearly FF consumption in forest ecosystems increases, which results in decreased emissions during anomalous years. However, this assumption requires additional validation of our model calculations based on ground data in forests affected by wildfires, whose collection will also be sponsored by a research grant as part of development of a national system for monitoring over climatically active substances (Decree …, 2022).
Presumably, 2022 will be a regular wildfire season in Russia that may not exceed the areas of forest wildfires and direct wildfire carbon emissions relative to the average long-term values.
Considering the space of distributed wildfire carbon emissions in 2021 in Russia (Fig. 2), it can be noted that the main contribution is traditionally made by regions of the Urals (Khanty-Mansiysk and Yamal-Nenets Autonomous Okrugs), Siberia (Tomsk Oblast, Krasnoyarsk Krai, Irkutsk Oblast), and the Far East (Republic of Sakha (Yakutia), Zabaykalsky Krai, and Amur Oblast). There is also an increase in flammability and carbon emissions in the northern latitudes of the European part of Russia’s forests compared to 2020 (Ershov, Sochilova, 2022).
Figure 3 shows the deviation of specific pyrogenic carbon emissions in 2021 relative to the long-term average values. In 2021 (as in 2020), excessive carbon emissions relative to the average long-term values was observed in forests of the Republic of Yakutia, in most areas of Magadan Oblast and Chukotka Autonomous Okrug, and in the north of Khabarovsk Krai. Also, the emissions of 2021 exceeded the average long-term values on forest lands in the Volga region and north-western areas. In the European and southern parts of Russia, excessive carbon emissions over the long-term average values are local and fragmented.
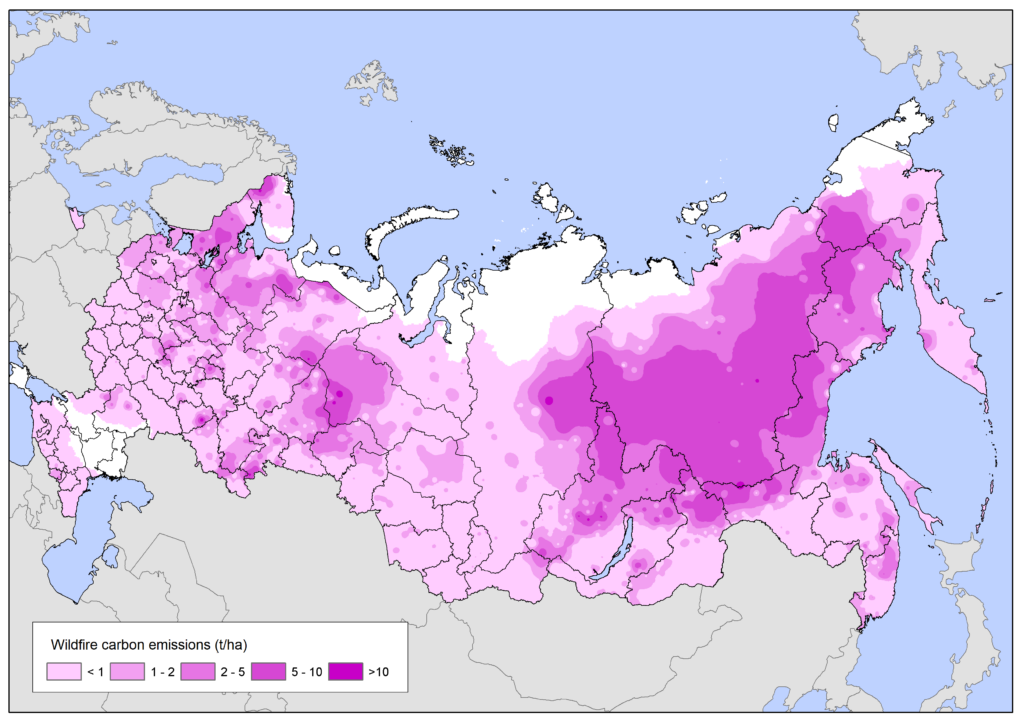
Figure 2. Distribution map of direct specific wildfire carbon emissions (t/ha) in 2021 in Russian forests
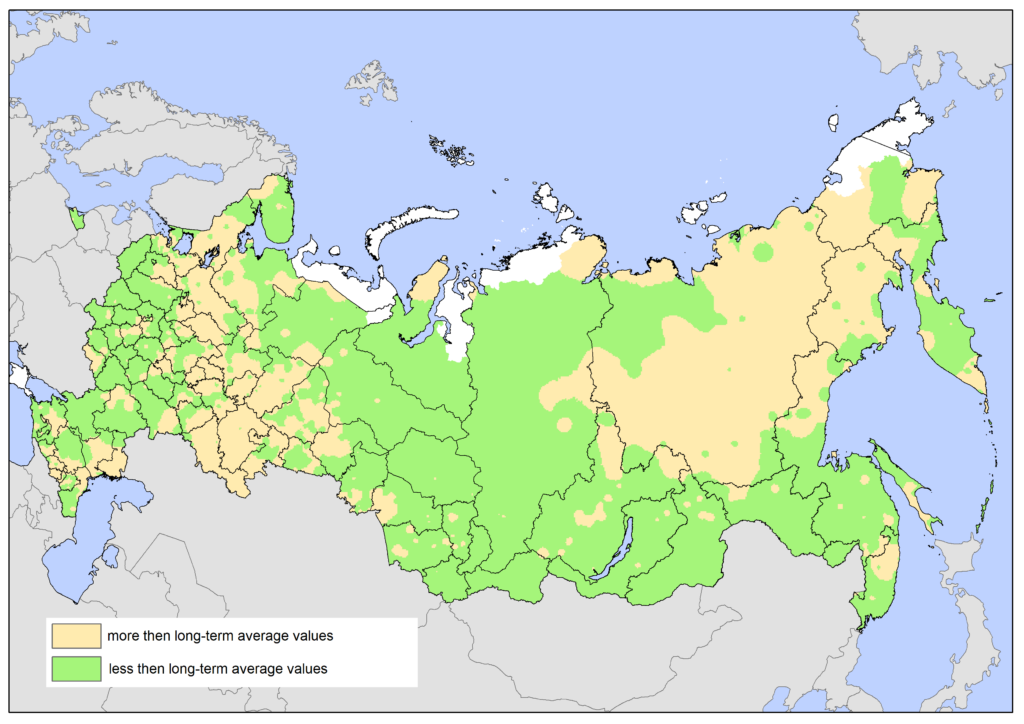
Figure 3. Map of deviations of direct pyrogenic carbon emissions in 2021 relative to long-term average values
CONCLUSION
The yearly direct pyrogenic emissions of carbon and other greenhouse gases resulting from forest wildfires in Russia in 2021 were estimated by method of the Center of Forest Ecology and Productivity of the Russian Academy of Sciences. The calculations of biomass reserve consumption of forest fuel for various wildfire types and intensities showed underestimated values relative to other studies, which is associated with an underestimation of pre-fire reserves of the main combustion conductors in forests of Russia. We plan to significantly modernize the calculation methodology by using up-to-date models for assessing the biomass of forest fuel layers and new sets of themed satellite products of medium spatial resolution (230 m).
According to the results of the current methodology, the forest areas affected by wildfires amounted to 9.3 million ha in 2021, and direct wildfire carbon emissions were estimated at 66.4 MtC. Our assumptions that 2021 would be an anomalous year in terms of wildfires and greenhouse gas emissions resulting from forest wildfires have been confirmed to be true. We also detected the recurring anomalous wildfire seasons once every nine years over the past 20 years of monitoring. More research is needed to determine the cause and relations of this recurrence. It is important to note that emissions during anomalous years are systematically decreasing, which is probably due to the increase in large high-intensity wildfires in forests and increased consumption of forest fuel during regular fire seasons.
FUNDING
Statistical evaluation of pyrogenic emissions was carried out within the framework of a government assignment for the Center of Forest Ecology and Productivity of the Russian Academy of Sciences AAAA-A18-118052590019-7; development and analysis of satellite products and geographic data maps were supported by Russian Science Foundation (project No 19-77-30015).
REFERENCES
Bartalev S. A., Egorov V. A., Zharko V. O., Lupjan E. A., Plotnikov D. E., Hvostikov S. A., Shabanov N. V., Sputnikovoe kartografirovanie rastitel’nogo pokrova Rossii (Land cover mapping over Russia using Earth observation data), Moscow: IKI RAN, 2016, 208 p.
Ershov D. V., Bartalev S. A., Isaev A. S., Sochilova E. N., Stycenko F. V., Metod ocenki pozharnyh jemissij parnikovyh gazov s ispol’zovaniem sputnikovyh dannyh: rezul’taty primenenija dlja lesov Rossii v 21 veke (Fire assessment method of greenhouse gas emission with satellite data: results of forest for Russia in the 21st century), Ajerokosmicheskie metody i geoinformacionnye tehnologii v lesovedenii, lesnom hozjajstve i jekologii (Aerospace Methods and GIS-Technologies in Forestry, Forest Management and Ecology), Proc. VI All-Russian Conference, Moscow, Russia, April 20-22, 2016, pp. 12–17.
Ershov D. V., Kovganko K. A., Sochilova E. N., GIS-tehnologija ocenki pirogennyh jemissij ugleroda po dannym Terra-MODIS i gosudarstvennogo ucheta lesov (GIS-technology of fire carbon emission assessment using Terra-Modis products and state forest account data), Sovremennye problemy distancionnogo zondirovanija Zemli iz kosmosa, 2009, Issue 6, Vol. 2, pp. 365–372.
Ershov D. V., Sochilova E. N., Dvadcatiletnjaja dinamika prjamyh pirogennyh jemissij ugleroda v lesah Rossii v 21 veke po dannym distancionnogo monitoringa (Twenty-year dynamics of direct pyrogenic carbon emissions in the forests of Russia in the 21st century according to remote monitoring data), Nauchnye osnovy ustojchivogo upravlenija lesami (Scientific Basis for Sustainable Forest Management), Proc. IV All-Russian Conference, Moscow, Russia, April 21–25, 2022, pp. 267–269.
Ershov D. V., Sochilova E. N., Ocenka prjamyh pirogennyh jemissij ugleroda v lesah Rossii za 2020 god po dannym distancionnogo monitoringa (Assessment of direct pyrogenic carbon emissions in russian forests for 2020 using remote monitoring data), Voprosy lesnoj nauki, 2020, Vol. 3, No 4, pp. 1–8.
Fedorov E. H., Cykalov A. G., Nazemnye gorjuchie materialy v zelenomoshnyh listvennichnikah Srednej Sibiri (Land fire fuels in green-moss larch forest of Central Siberia), Lesovedenie, 2002, No 6, pp. 63–67.
Furjaev I. V., Dement’eva Ju. S., Furjaev V. V., Struktura kompleksov napochvennyh gorjuchih materialov v nasazhdenijah Verhne-Obskogo massiva Altajskogo kraja (Structure of complexes of ground fire fuels in the stands of the Verkhne-Ob massif of the Altai Region), In: Problemy lesovedenija i lesovodstva (Problems of forest science and forestry), Issue 69, 2009, pp. 737–742.
Furjaev V. V., Zablockij V. I., Zlobina L. P., Chernyh V. A., Samsonenko S. D., Kompleksy napochvennyh gorjuchih materialov i vozmozhnost’ ih regulirovanija v profilaktike lesnyh pozharov (Complexes of ground fire fuels and the possibility of their regulation in the prevention of forest fires), Lesnoe hozjajstvo, 2007, No 1, pp. 43–44.
Kharuk V. I., Ponomarev E. I., Ivanova G. A., Dvinskaya M. L., Coogan S. C. P., Flannigan M. D., Wildfires in the Siberian taiga, Ambio, 2021, Vol. 50, pp. 1953–1974, DOI: 10.1007/s13280-020-01490-x.
Kovaleva N. M., Sobachkin R. S., Sobachkin D. S., Petrenko A. E., Struktura gorjuchih materialov v sosnjakah raznogo vozrasta Krasnojarskoj stepi (The structure of forest fuels in variously aged pine woodlands of forest steppe domain in Krasnoyarsk), Lesovedenie, 2017, No 5, pp. 431–436, DOI: 10.7868/S0024114817060055.
Kurbatskij N. P., Issledovanie kolichestva i sostava lesnyh gorjuchih materialov (Investigation of quantity and composition of the forest fire fuels), In: Voprosy lesnoj pirologii (Questions of forest pyrology), Krasnojarsk, 1970, pp. 5−58.
Lupjan E. A., Proshin A. A., Burcev M. A., Kashnickij A. V., Balashov I. V., Bartalev S. A., Konstantinova A. M., Kobec D. A., Mazurov A. A., Marchenkov V. V., Matveev A. M., Radchenko M. V., Sychugov I. G., Tolpin V. A., Uvarov I. A., Opyt jekspluatacii i razvitija centra kollektivnogo pol’zovanija sistemami arhivacii, obrabotki i analiza sputnikovyh dannyh (CKP “IKI-Monitoring”) (Experience of development and operation of the IKI-Monitoring center for collective use of systems for archiving, processing and analyzing satellite data), Sovremennye problemy distancionnogo zondirovanija Zemli iz kosmosa, 2019, Vol. 16, No 3, pp. 151–170. DOI: 10.2104
Matveeva T. A., Zapasy lesnyh gorjuchih materialov v gornyh lesah Juzhnoj Sibiri (Wood combustibles resources in mountain forests of south Siberia), Vestnik Altajskogo gosudarstvennogo agrarnogo universiteta, 2008, No 12 (50), pp. 30–33.
Ponomarev E., Yakimov N., Ponomareva T., Yakubailik O., Conard S. G., Current trend of carbon emissions from wildfires in Siberia, Atmosphere, 2021, Vol. 12 (5), Article 559. DOI: 10.3390/atmos12050559.
Rasporyazhenie Pravitel’stva Rossijskoj Federacii ot 29 oktyabrya 2022 goda № 3240-r (Government Decree of the Russian Federation No 3240-r, October 29, 2022) “Ob utverzhdenii innovacionnogo proekta po sozdaniyu nacional’noj sistemy monitoringa klimaticheski aktivnyh veshchestv”, 2022, 30 p., available at: URL: http://government.ru/docs/46939/ (November 14, 2023).
Schepaschenko D. G., Muhortova L. V., Shvidenko A. Z., Vedrova Je. F., Zapasy organicheskogo ugleroda v pochvah Rossii (The pool of organic carbon in the soils of Russia), Pochvovedenie, 2013, No 2, pp. 123–132.
Schepaschenko D., Moltchanova E., Shvidenko A., Blyshchyk V., Dmitriev E., Martynenko O., See L., Kraxner F., Improved estimates of biomass expansion factors for Russian forests, Forests, 2018, Vol. 9 (6), Article 312, DOI: 10.3390/f9060312
Sheshukov M. A., Vlijanie nekotoryh faktorov sredy na polnotu sgoranija gorjuchih materialov i ih kriticheskij zapas pri lesnyh pozharah (Impact of some environmental factors on complete combustion of fire fuels and their critical volume in case of forest fires), Lesovedenie, 1970, No 4, pp. 40–43.
Shvidenko A. Z., Schepaschenko D. G., Climate change and wildfires in Russia, Contemporary Problems of Ecology, 2013, Vol. 6, No 7, pp. 683–692, DOI: 10.1134/S199542551307010X.
Shvidenko A. Z., Schepaschenko D. G., Nil’sson S., Buluj Ju. I., Tablicy i modeli hoda rosta i produktivnosti nasazhdenij osnovnyh lesoobrazujushhih porod Severnoj Evrazii (normativno-spravochnye materialy) (Tables and models of growth and productivity of forests of major forest forming species of Northern Eurasia (standard and reference materials)), Moscow: Federal’noe agentstvo lesnogo hozjajstva, 2008, 803 p.
Shvidenko A., Schepaschenko D., Nil’sson S., Ocenka zapasov drevesnogo detrita v lesah Rossii (Assessment of wood detritus storage in forests of Russia), Lesnaja taksacija i lesoustrojstvo, 2009, No 1 (41), pp. 133–147.
Sochilova E. N., Ershov D. V., Korovin G. N., Metody sozdanija kart zapasov lesnyh gorjuchih materialov nizkogo prostranstvennogo razreshenija (Methods of course resolution forest fuel load mapping), Sovremennye problemy distancionnogo zondirovanija Zemli iz kosmosa, 2009, Vol. 2, Issue 6, pp. 441–449.
Stycenko F. V., Bartalev S. A., Egorov V. A., Lupjan E. A., Metod ocenki stepeni povrezhdenija lesov pozharami na osnove sputnikovyh dannyh MODIS (Post-fire forest tree mortality assessment method using MODIS satellite data), Sovremennye problemy distancionnogo zondirovanija Zemli iz kosmosa, 2013, Vol. 10, No 1, pp. 254–266.
Tsvetkov P. A., Zapasy gorjuchih materialov v lesah severo-vostoka Jevenkii (Stocks of fire fuels in the forests of the north-east of Evenkia), Lesnoe hozjajstvo, 2001, No 4, pp. 93–96.
Utkin A. I., Gul’be Ja. I., Gul’be T. A., Ermolova L. S., Biologicheskaja produktivnost’ lesnyh jekosistem (Biological productivity of forest ecosystems), Database, Moscow: IL RAN, CEPL RAN, 1994.
VEGA-RRO, available at: http://pro-vega.ru (November 29, 2022)
Vonskij S. M., Intensivnost’ ognja nizovyh lesnyh pozharov i ee prakticheskoe znachenie (The intensity of ground forest fires and their practical significance), Leningrad: LenNIILH, 1957, 52 p.
Zamolodchikov D. G., Korovin G. N., Utkin A. I., Chestnyh O. V., Sangen B., Uglerod v lesnom fonde i sel’skohozjajstvennyh ugod’jah Rossii (Carbon in forest and agricultural lands of Russia), Moscow: KMK, 2005, 200 p.
Zamolodchikov D. G., Utkin A. I., Chestnyh O. V., Kojefficienty konversii zapasov nasazhdenij v fitomassu dlja osnovnyh lesoobrazujushhih porod Rossii (Conversion factors of forest stocks volumes in biomass for the main dominated forest species of Russia), Lesnaja taksacija i lesoustrojstvo, 2003, Issue 1 (32), pp. 119–127.
Reviewed by: A. Z. Shvidenko, Doctor of Agricultural Sciences