- DOI 10.31509/2658-607x-202252-114
Application of gis technologies to build spatial predictors for mapping forest ecosystem functions at the local level
![]()
Original Russian Text © 2022 M. S. Savin, A. S. Plotnikova, A. N. Narykova published in Forest Science Issues Vol. 5, No 2, Article 105.
© 2022 M. S. Savin1, A. S. Plotnikova2, A. N. Narykova2
1 Faculty of Geography of Moscow State University
2 Center for Forest Ecology and Productivity of the RAS
Profsoyuznaya st. 84/32 bldg. 14, Moscow, 117997, Russia
E-mail: odm244@gmail.com
Received: 18.04.2022
Revised: 15.05.2022
Accepted: 25.05.2022
The article presents the experience of using GIS technologies to prepare spatial predictors for their further use in modeling and mapping the dynamics of forest ecosystem functions. The study was conducted on the territory of the Dankovsky district forestry, which is located in the south of the Moscow region. GIS analysis of spatial data containing information about the relief and the hydrographic network of the study area was performed. As a result, morphometric values describing the surface runoff and altitude zonality of the study area have been created. The article describes GIS tools that can be used to create thematic geospatial products: slope exposure, steepness and curvature; direction, distance and length of the flow line, total flow; average altitude above sea level and distance to the river. In addition, the boundaries of river catchment basins have been identified by using GIS analysis, within which it is also planned to model climate-regulating forest functions associated with the carbon cycle.
Keywords: GIS analysis, forests, climate-regulating functions and services, morphometric relief value, DEM, SRTM, OSM
Natural ecosystems are inextricably intertwined with ecosystem processes occurring therein, i. e. physical, chemical and biological forces or events linking organisms and their environment (Ecosystem processes, 2022). The totality of physical, biological, chemical and other processes that support the integrity and maintain the ecosystem is commonly referred to as ecosystem functions (Ansink et al., 2008). Ecosystem services are understood as the benefits that people obtain from ecosystems (Alсamo et al., 2005).
Four categories of ecosystem services are identified based on the types of benefits for humans in accordance with the Millennium Ecosystem Assessment (2005) classification: Provisioning, Regulating, Cultural and Supportive Services. Various mechanisms of ecosystem regulation of environmental indicators are considered as Regulating Services — in particular, climate regulation, hydrological regime regulation, erosion control, pollination and others. Mapping of climate-regulating services of forests is an important issue. It is associated with the functions of biomass production, carbon and nitrogen cycle regulation, formation of natural soil fertility, etc. (Lukina et al., 2020). This approach can be used as a tool for the topics of biodiversity and creating decision support systems.
To date, mapping of ecosystem functions and services at the local level has been most developed in Western Europe (Spain, Italy, Germany, Sweden, etc.) and the USA. The objective of many studies is the assessment and mapping of the ecosystem services, including climate regulation (Burkhard et al., 2009; Palomo et al., 2013; Felipe-Lucia et al., 2014; Istomina, Luzhkova, 2017). There are works on mapping carbon stocks in soils (Chan et al., 2006; Garcia-Pausas et al., 2007); soil stability (Nelson et al., 2009; Felipe-Lucia et al., 2014; Bruno et al., 2021); regulation of runoff (Burkhard et al., 2009; Nedkov et al., 2015) and the quality of water resources (Bruno et al., 2021).
According to current studies, mapping of ecosystem functions and services may include construction of regression models using machine learning methods. The purpose of this work is to create predictors by conducting GIS analysis of spatial data for their further use in modeling and mapping of forest ecosystem functions, including climate-regulating ones.
OBJECTS AND MATERIALS OF THE STUDY
The study investigates the territory of the Dankovsky district forestry, which is located in the south of the Moscow region on the border between the Moskvoretsko-Okskaya and Zaokskaya physiographic provinces (Atlas GUGK, 1976) (Fig. 1). The relief of the southern part of the Moscow region typically has wide, well-developed river valleys and a developed ravine network. There are also karst relief forms such as craters, caves, sinkholes in places close to the surface of carbonate rocks of the Carboniferous period (Vagner, Manucharjanc, 2003). Similar landforms could be found in Prioksko-Terrasny Biosphere Reserve, bordering the study area.
The Moscow region has a fairly dense river network with more than four hundred small and large rivers of the Caspian Sea basin. The Rechma, the Sushka and the Todenka are tributaries of the Oka river, which is one of the largest rivers of the Moscow region. It runs through the Dankovsky forest district, a research territory of interest (Fig. 1). In the soil cover of the forest zone of the Moscow region, sod-podzolic soils and podzols predominate, whereas in the floodplains of rivers, alluvial soils are common (Soil map of the Moscow region, 1985).
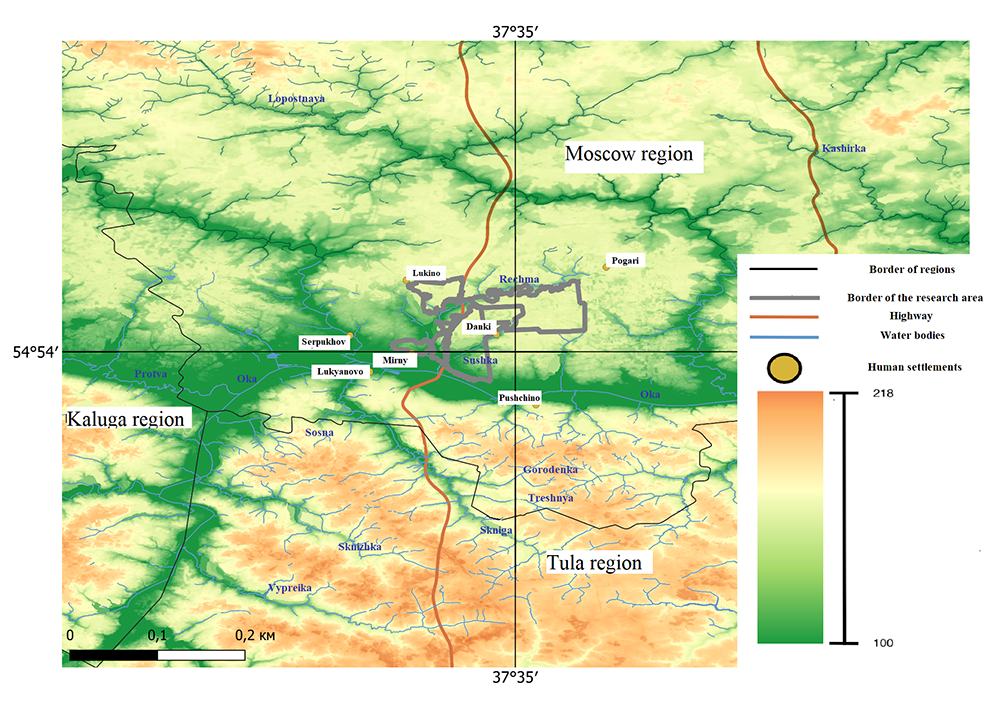
Figure 1. Study area — Dankovsky district forestry of the Moscow region
The study included the analysis of spatial data containing information about the relief and the hydrographic network of the object of study by means of a geographic information system (GIS). Open data from the OpenStreetMap (OSM) mapping project were used for GIS analysis of the hydrographic network. OSM data are provided in common geoinformation formats, are divided by layers and have a clear structure of attribute information.
Currently, two types of digital elevation models (DEMs) are most common — raster models with a regular height network (GRID) and TIN models with an irregular triangulation network. Out of the many existing DEMs (GMTED2010, ASTER GDEM2, SPOT DEM, Next Map, NextMap World 30, TanDEM-X Global DEM, etc.), the Shuttle Radar Topography Mission (SRTM) raster model with a grid cell size of 30 × 30 m was selected for the study. The model was obtained by satellite radar imaging with SIR-C and X-SAR instruments and covers the territory of the Earth between 60°N and 54°S (USGS …, 2022). As was noted in the work of Ju. I. Karionov (2010), SRTM has a high degree of correspondence of the relief to topographic maps plotted to a scale of 1:100 000–1:50 000.
GIS TOOLS FOR SPATIAL DATA ANALYSIS
The impact of morphometric values representing surface runoff and altitude zonality should be assessed in models of climate-regulating functions of forests at the local level (Kuznetsova et al., 2020) (Fig. 2). Morphometric value (MV) refers to the numerical characters of the relief defined at each point of the map, such as slope height, steepness or exposure (Sharyj, 2006). This MV, along with the roughness (ruggedness) of the terrain, geometric shapes and thermal regimen of the slopes are one of the main aspects of the effect of relief on the functioning of the ecosystem.
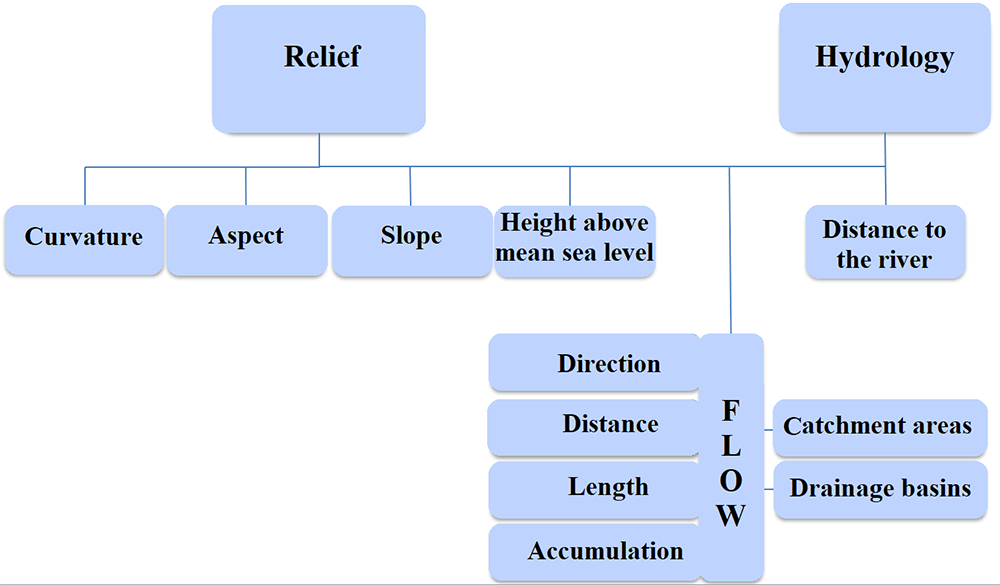
Figure 2. Schematic diagram of preparation of spatial predictors
The research used ESRI (Environmental Systems Research Institute) software — the geographic information system of ArcGIS Desktop, supplemented with the Spatial Analyst module for spatial modeling and analysis. This module allows user to create, analyse and display raster data in the cartographic interface. Spatial Analyst can be used for raster data vectorization as well.
Identification of morphometric values describing surface runoff
The ArcGIS Spatial Analyst module contains tools of the Hydrology toolset used to simulate the movement of water on the surface using a digital elevation model. Thematic tools of this group can be used independently or sequentially to build a network of streams or identify watersheds. The following tools were used: Flow Direction, Flow Distance and Flow Length for the runoff, Flow Accumulation for the total flow (Overview of the Hydrology toolset).
The Flow Direction tool creates a raster layer of flow direction from each pixel of the DEM to its steepest downslope neighbor. The methods of single and multiple flow directions were used. In the case of a single direction, the flow from the cell is running exclusively to one neighboring cell; in the case of multiple directions, the flow is distributed between different neighboring cells. The method of single flow direction D8 was used in the study, implying flow into only one of eight neighboring cells. A detailed description of the Flow Direction tool is given in the article by A. S. Plotnikova et al. (2017).
The Flow Length tool calculates the length of the flow inside the river basin. The input data is a raster layer of the flow direction. The tool makes it possible to choose the direction of measuring the length of the flow line: down or up the slope to the watershed line of the catchment basin area. The results can be applied in solving a wide range of ecological and hydrological problems, in particular, calculating the time of water passage to the outlet or for modeling surface runoff.
The Flow Distance tool calculates the minimum distance following the flow path to the cell into which they flow. The tool analyzes the raster layer of the flow direction D8. For each cell, one possible path downhill to the drain cell is identified, along which the flow distance is measured. In addition to the DEM and the flow direction, raster data of streams are required for the Flow Distance tool. The original vector data of OSM streams were translated into a raster representation using the Polyline to Raster tool of the To Raster toolset of the Conversion Tools data conversion module. The cells of the resulting raster layer are assigned to a particular spatial object as a result of applying the maximum or combined length method. The tool provides an option of interactive method selection.
The Flow Accumulation tool is used to create a raster layer of total flow to each pixel of the DEM. The input data is a raster layer of the flow direction. Pixels of the output raster layer with a high flow accumulation are areas of concentrated flow, where pixels with a flow accumulation of zero are sections of the watershed line (Jenson, Domingue, 1988). The tool requires the user to set the number of pixels involved in the flow analysis. Apart from that, based on the raster layer of the flow direction, the ArcGIS Spatial Analyst module allows to select the boundaries of river catchment basins (Fig. 3). The Basin or Watershed tools are used, which are described in detail in the work by A. S. Plotnikova and A. O. Kharitonova (2018).
The tools of the Surface toolset are used to determine the slope exposure, steepness and curvature. The Aspect tool creates raster surface of the exposure using the 3 × 3 cell “moving window” method. The result reflects the spatial orientation of the elementary slope of the DEM. Measurements are performed clockwise in degrees from 0 (north) to 360 (north again), making a full circle.
The Slope tool identifies the slope steepness, i. e. the degree of surface change in the horizontal and vertical directions. The tool finds the maximum height change per unit distance between the analyzed cell and eight surrounding neighbors. As a result, a raster layer of slope steepness is created in two different units of measurement — degrees or percentage points.
The Curvature tool creates a raster layer of the standard curvature of the slope, taking into account the profile and plan curvature. The profile curvature describes the angle of the maximum slope and is built parallel to the slope. Thus, the curvature of the profile characterizes the flow velocity on the surface. A negative value in the profile output indicates the surface as upwardly convex at the analyzed cell. It means that the flow slows down. A positive value indicates that the surface is upwardly concave, which means the acceleration of the flow. A positive value indicates the surface is upwardly concave — the flow accelerates. A value of 0 indicates the surface is flat and has a constant angle of slope. The plan curvature is perpendicular to the angle of maximum slope. The plan curvature characterizes the horizontal flow direction — convergence and divergence of the flow on the surface. In the planned output, a positive value indicates the surface is upwardly convex at that cell. A negative value indicates the surface is upwardly concave at that cell. A zero value also characterizes a surface with a constant angle of slope. Simultaneous consideration of both types of curvature, called standard curvature, allows us to better understand the patterns of redistribution of matter in liquid or solid form along the slope.
Identification of morphometric values describing altitude zonality
The Zonal Statistics as Table tool of the Zonal toolset is used to find the value of the average altitude above sea level within the forest subcompartment that in the future will serve as a spatial unit for regression modeling of ecosystem functions of the object of study. The SRTM DEM and the vector layer of the boundaries of forest subcompartments are employed as an input dataset for the Zonal Statistics as a Table tool. As an output, we got a table of average heights within the subcompartment.
The final predictor created by GIS analysis of spatial data is the distance to the river, which was calculated in two stages. First, we found the centroid of the polygon of the forest subcompartment. This task was performed using the Feature To Point tool from the Features toolset of the ArcGIS Data Management Tools module. The tool translates input polygonal objects into output points — centroids of polygons. Then, the distance from the centroid of the subcompartment polygon to the object of the hydrological network was calculated using the Near tool of the Proximity toolset of the ArcGIS Analysis Tools data analysis module.
RESULTS AND DISCUSSION
The conducted research resulted in obtaining morphometric values describing surface runoff (direction, distance and length of the flow line, total flow; slope exposure, steepness and curvature) and altitude zonality (average altitude above sea level) of the Dankovsky district forestry. The obtained morphometric values can be considered as predictors for modeling climate-regulating functions, including those related to the carbon stocks and the formation of water runoff.
Figure 3 highlights the boundaries of the catchment basins of the rivers in the area of study. It is apparent that they correlate well with the results obtained in Kazan Federal University (Ermolaev et al., 2017). Kazan researchers propose to use the map of river basins of the European territory of Russia they had created for various geoecological assessments. There are quite a few examples of modern scientific research using the river basin as an object of environmental monitoring (Smolyaninov et al., 2007; Liseckij et al., 2014; Kharitonova et al., 2019).
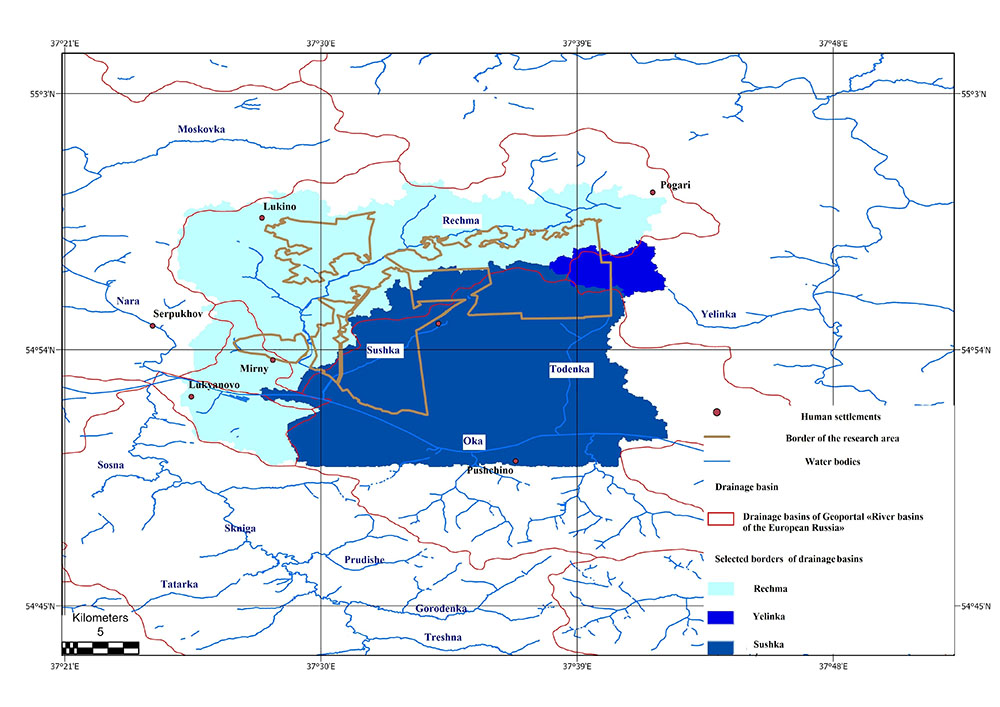
Figure 3. Highlighted boundaries of river catchment basins
The boundaries of the river basins of the European territory of Russia are identified on the basis of the GMTED2010 DEM with a resolution of 250 m. In addition to the boundaries, the map contains data on the nature, resource potential and ecological condition of the basin. Subject information like this will be useful in assessing the climate-regulating functions of forests related to the carbon cycle — for example, the dynamics of carbon stocks and the formation of the hydrological regime.
The above description of GIS tools used to analyze terrain and hydrographic network data for determining the direction, distance and length of the flow line, as well as exposure, steepness and curvature of the slope is of interest for various environmental studies within the framework of the basin concept of nature management.
FINANCING
The work was carried out as part of an additional agreement to the state task of the CEPF RAS (registration number 122110700044-2) in accordance with the Decree of the Government of the Russian Federation dated September 2, 2022 No 2515-р for the implementation of the most important innovative project of national importance aimed at creation of a unified national monitoring system for climatically active substances.
REFERENCES
Alсamo J., Ash N., Bennett E., Biggs R., Butler C., … & Zurek М., Ecosystems and human wellbeing: a framework for assessment, Washington, D. C., USA, Island Press., 2003, 245 p.
An overview of the Hydrology toolset, ArcGIS for Desktop, URL: https://clck.ru/rL5FL (2022, 17 January).
An overview of the Raster Surface toolset, ArcGIS for Desktop, URL: https://clck.ru/rL6Ao (2022, 25 January).
Ansink E., Hein L., Hasund K. P., To value functions or services? An analysis of ecosystem valuation approaches, Environmental Values, 2008, Vol. 17, No 4, pp. 489–503.
Atlas GUGK, Moscow region, 1976, https://clck.ru/rL4yh (2022, 15 January).
Bruno D., Sorando R., Álvarez-Farizo B., Castellano C., Céspedes V., Gallardo B., … & Comín F. A., Depopulation impacts on ecosystem services in Mediterranean rural areas, Ecosystem Services, 2021, Vol. 52, Article 101369.
Burkhard B., Kroll F., Müller F. Windhorst W., Landscapes’ Capacities to Provide Ecosystem Services — a Concept for Land-Cover Based Assessments, Landscape Online, 2009, No 15, pp. 1–22.
Chan K. M. A., Shaw M. R., Cameron D. R., Underwood E. C., Daily G. C., Conservation planning for ecosystem services, PLoS Biology, 2006, Vol. 4, No 11, 379 p.
Ecosystem processes, GreenFacts URL: https://clck.ru/rL978 (2022, 15 May).
Ermolaev O. P., Mal’cev K. A., Muharamova S. S., Harchenko S. V., Vedeneeva E. A., Kartograficheskaja model’ rechnyh bassejnov Evropejskoj Rossii (Cartographic model of river basins of European Russia), Geografija i prirodnye resursy, 2017, No 2, pp. 27–36.
Felipe-Lucia M. R., Comín F. A., Bennett E. M., Interactions among ecosystem services across land uses in a floodplain agroecosystem, Ecology and Society, 2014, Vol. 19, No 1, Article 20.
Garcia-Pausas J., Casals P., Camarero L. Soil organic carbon storage in mountain grasslands of the Pyrenees: effects of climate and topography, Biogeochemistry. 2007, Vol. 82, No 3, pp. 279–289.
Istomina E. A., Luzhkova N. M., Kartografirovanie jekosistemnyh uslug v Zabaĭkal’skom nacional’nom parke (Mapping of the ecosystem services in Zabaikalskiy National Park) Geodezija i kartografija, 2017, Vol. 78, No 7, pp. 59–67.
Jenson S. K., Domingue J. O., Extracting Topographic Structure from Digital Elevation Data for Geographic Information System Analysis, Photogrammetric Engineering and Remote Sensing, 1988, Vol. 54, No 11, pp. 1593–1600.
Karionov Ju. I. Ocenka tochnosti matricy vysot SRTM (The estimation of the accuracy of the SRTM), Geoprofi, 2010, No 10, pp. 48–51.
Kharitonova A. O., Plotnikova A. S., Ershov D. V., Sovremennye i istoricheskie pozharnye rezhimy Pechoro-Ilychskogo zapovednika i ego okrestnostej (Mapping of terrestrial ecosystems of the Pechora-Ilychsky Reserve and its surroundings), Voprosy lesnoj nauki, 2019, Vol. 2, No 3, pp. 1–17, DOI: 10.31509/2658-607x-2019-2-3-1-17.
Kuznetsova A. I., Lukina N. V., Gornov A. V., Gornova M. V., Tikhonova E. V. … & Genikova N. V., Zapasy ugleroda v peschanykh pochvakh sosnovykh lesov na zapade Rossii (Carbon Stock in Sandy Soils of Pine Forests in the West of Russia), Pochvovedenie, 2020, No 8, pp. 959–969.
Liseckij F. N., Grigor’eva O. I., Kirilenko Zh. A., Nauchnoe soprovozhdenie bassejnovoj organizacii prirodopol’zovanija v Belgorodskoj oblasti, Dvadcat’ devjatoe plenarnoe mezhvuzovskoe koordinacionnoe soveshhanie po probleme jerozionnyh, ruslovyh i ust’evyh processov (The identification of drainage basins borders at local spatial scale), Moscow: Mezhvuzovskij nauchno-koordinacionnyj sovet po probleme jerozionnyh, ruslovyh i ust’evyh processov pri MGU, 2014, pp. 106–107.
Lukina N. V., Geraskina A. P., Gornov A. V., Shevchenko N. E., Kuprin A. V., … & Gornova M. V., Bioraznoobrazie i klimatoregulirujushhie funkcii lesov: aktual’nye voprosy i perspektivy issledovanij (Biodiversity and climate regulating functions of forests: current issues and prospects for research), Voprosy lesnoj nauki, 2020, Vol. 3, No 4, DOI: 10.31509/2658-607x-2020-3-4-1-90.
Millennium Ecosystem Assestment. Ecosystems and Human Well-Being, Washington, DC, USA: Island Press, 2005, Vol. 5, 155 p.
Nedkov S., Boyanova K., Burkhard B., Quantifying, Modelling and Mapping Ecosystem Services in Watersheds, Ecosystem Services and River Basin Ecohydrology, 2015, pp. 133–149.
Nelson E., Mendoza G., Regetz J., Polasky S., Tallis H., … & Shaw M. R., Modeling Multiple Ecosystem Services, Biodiversity Conservation, Commodity Production, and Tradeoffs at Landscape Scales, Frontiers in Ecology and the Environment, 2009, Vol. 7, No 1, pp. 4–11.
Palomo I., Martin-Lopez B., Potschin M., Haines-Young R., Montes C., National Parks, buffer zones and surrounding lands: Mapping ecosystem service flows, Ecosystem Services, 2013, Vol. 4, pp. 104–116.
Plotnikova A. S., Ershov D. V., Kharitonova A. O., Ispol’zovanie GIS-tehnologij pri kartografirovanii pozharnyh rezhimov lesnyh jekosistem Pechoro-Ilychskogo zapovednika (Gis Technologies Application for Forest Fire Regimes Mapping Over Pechora Natural Reserve), Geodezija, kartografija, geoinformatika i kadastry, Ot idei do vnedrenija, Sbornik materialov, St. Petersburg: Politehnika, 2017, pp. 464–470.
Plotnikova A. S., Kharitonova A. O., Vydelenie granic vodosbornyh bassejnov rek na lokal’nom prostranstvennom urovne (Identifocation of drainage basin borders at local spatial level), Voprosy lesnoj nauki, 2018, Vol 1, No 1, pp. 1–10, DOI: 10.31509/2658-607x-2018-1-1-1-10.
Sharyj P. A., Geomorfometrija v naukah o Zemle i jekologii, obzor metodov i prilozhenij (Geomorphometry in Earth Sciences and ecology, review of methods and applications), Izvestija Samarskogo nauchnogo centra RAN, 2006, Vol. 8, No 2, pp. 458–473.
Smolyaninov V. M., Degtjarev S. D., Shherbinina S. V., Jekologo-gidrologicheskaja ocenka sostojanija rechnyh vodosborov Voronezhskoj oblasti (Ecological-hydrological assessment of the Voronezh Region River basins state), Voronezh: Istoki, 2007, 133 p.
Soil map of the Moscow region, 1985, https://clck.ru/rL28X (2022, 25 January)
USGS EROS Archive — Digital Elevation — SRTM Coverage Maps, Earth resources observation and science center, USA, 2022, URL: https://clck.ru/rKuM9 (2022, 15 January).
Vagner B. B., Manucharjanc B. O., Geologija, rel’ef i poleznye iskopaemye moskovskogo regiona (Geology, relief and minerals of the Moscow region), Moscow: MPGU, 2003, pp. 50–65.
Reviewer: Candidate of Technical Sciences V. S. Gruzinov