- DOI 10.31509/2658-607x-2019-2-2-1-27
Cartographic estimation of tree parameter dynamics in Russian northwest
С текстом оригинальной статьи Вы можете ознакомиться по ссылке
![]() © 2019 г.
© 2019 г.
S.V. Knyazeva, S.P. Eydlina
Center for Forest Ecology and Productivity of the RAS
Profsoyuznaya st. 84/32 bldg. 14, Moscow, 117997, Russia
Received 20 November 2018
The article presents an analysis of spatial variability and temporal dynamics of tree plant condition indicators in the regions of the Russian Northwest over 2008 – 2010 based on the regular network of ground monitoring organised under the ICP Forests international programme. Indicators for trees of dominant species in permanent observation plot (POP) included defoliation, discoloration, condition category, and damage extent. The indicator dynamics was assessed based on procedures of geo-informational mapping and spatial analysis taking into account landscape-focused POP and human-induced impact. The total of 710 POP were analysed in six regions of Russia: Leningrad Region, Pskov Region, Novgorod Region, Kaliningrad Region, Murmansk Region, and the Republic of Karelia. As the research showed, indicators like defoliation degree and share of damaged trees were the most informative (sensitive to primary types of impact). Tree plants with a high level of defoliation were found in softwood forests formed in glaciolacustrine landscapes of low platform plains and in landscapes of high platform plains (Precambrian shields and ridges with glacier expressions) in the Republic of Karelia and Leningrad Region (Karelian Isthmus). The share of damaged trees increased from 23% in 2008 to 39% in 2010. Maximum values of the indicator (above 80%) over the entire observation period were found in four regions: the Republic of Karelia (predominantly on the Karelian Isthmus), Leningrad Region, Murmansk Region, and Kaliningrad Region. Occurrence of the most dangerous biotic causes of tree damages was high in Leningrad Region and the Republic of Karelia. The share of trees with diseases was higher in north taiga forests (30%) as compared to middle taiga forests (24%) and south taiga forests (19%). To the highest extent, the damage was manifested in POP focused on sand landscapes and in Precambrian shields and ridges of high platform plains. In general, the cartographic analysis of monitoring data collected over 2008-2010 showed the Karelian Isthmus (Leningrad Region) where middle taiga forests were steadily characterised by the worst average condition of tree plants within the entire ICP Forests network.
Key words: condition of tree plants, regular network, permanent observation plot, assessment of crown condition, dominant species, damage and diseases of trees, maps of parameters
The primary goal of ground monitoring of forests was systemic regular collection of data on condition parameters, degree and causes of forest damage for further analysis, making forecasts, taking decisions and development of measures to maintain productivity of forests and reasonable use of forest resources. Regular network-based monitoring is widely used within national forest inventory systems (NFI) in a number of countries that have most of their areas covered by forests, such as Canada, Sweden and Finland (Powell et al., 1994; Filipchuk et al, 1995; Tomppo, 2006; Shvidenko, 2007; Tomppo et al., 2011; Zhirin, Lukina, 2017). The NFI network design differs in various countries, but the selection of a regular network for multiple observations combined with stratification (zoning) makes it possible to reach an optimal cost-efficiency ratio (reliability) of the results obtained (Kangas et al., 2006). The regular network ensures spatial homogeneity of data collection and, therefore, an opportunity to form random samples yielding objective characteristics for the entire observation area that comply with the principle of representativity (optimal network density for this area) (Zhivotovsky, 1991). This is the simplest and most comprehensible way to organise monitoring that would allow for network cell size selection depending on the area and spatial level of the observation system. In Canada, the NFI is based on a system of sample plots (SP) located in 4 km nodes of the united national network of ground observations covering the entire country. Stratification of selective observation points is done over environmental zones ensuring optimal data thickness (20 х 20 km on average) for each NFI spatial unit usually represented by an administrative unit (province) of the country (Wulder et al., 2003; Gillis et al., 2005). The Swedish NFI is based on systematic selection within regular network nodes with the distance of 3 to 10 km that changes depending on regional peculiarities of the country. One of the largest regular bio-indicator networks covering 41 countries of Europe and Northern America is formed in the system of forest condition monitoring under ICP Forests. This international network is based on a monitoring network of 16 х 16 km, which corresponds to the area of 25,600 ha. The network nodes accommodate points of permanent observation (POP). Depending on local conditions, different network parameters can be designed like 8 х 8 km, 4 х 4 km, 2 х 2 km, 1 х 1 km, or 32 х 32 km and 64 х 64 km for large forest areas (Methodological guidelines…, 2009).
ICP Forests is the international co-operative programme for assessment and monitoring of how air pollution affects forests that was established in 1985 by the UN Economic Commission for Europe (UNECE) under the Convention on Long-Range Transboundary Air Pollution (CLRTAP). Monitoring results are important for assessment of air pollution impact and other negative human-induced processes affecting the condition and biodiversity of forests and parameters of carbon cycles in the forests. The works under ICP Forests were first conducted in the Baltic republics of the USSR in 1987, and then continued in Leningrad Region in the 1990s (Bakhmet et al., 2011). However, the regular monitoring network was established within six regions of the Russian Northwest only in 2007-2008. Starting with 2008, forest monitoring under ICP Forests was conducted in Leningrad Region, Pskov Region, Novgorod Region, Kaliningrad Region, Murmansk Region, and the Republic of Karelia. In Murmansk Region and the Republic of Karelia, a regular network based on geographic coordinates with the cell size of 32х32 km was developed, and networks of 16х16 km were developed in other regions. Some scientists believe that the established regular network can potentially be used as a framework and scientific infrastructure for integrated studies of biodiversity among regions as well as for national inventory of forests (Alekseev et al., 2007, Bakhmet et al., 2011, Knyazeva et al., 2013).
Ground monitoring is arranged at two levels. The first level includes assessment of tree crowns, condition of soils, nutritional condition of tree plants, and biodiversity of plants. Condition of tree species is estimated based on indicators like crown defoliation degree, discoloration degree, tree condition category, damage and causes of damage (insect pests, diseases, etc.) as well as composition of photosynthesising organs in tree plants. The soils are characterised based on their morphological description, physical composition, acidity level, and chemical content. Assessment of plant biodiversity is based on details and structure of species. First-level ICP Forests monitoring in Russia is organised with 710 POP. Observation frequency suggests annual measurement of crown defoliation, discoloration, condition category, and damage of trees; measurement of plant biodiversity indicators once in five years; assessment of soil and nutritional condition of trees once in 10 years. The second level monitoring additionally includes collection and analysis of atmospheric precipitation samples and ground waters where the level of acidity and concentration of chemicals is measured.
Since 2006, the ICP Forests national coordination center in Russia has been the Center for Forest Ecology and Productivity of the RAS (CEPL RAS). The center organised a database maintained by the database management system MySQL that provides multi-user access to ICP Forests monitoring data. To represent monitoring data in a cartographic form, the professional ArcGIS software is used.
This study was aimed at representing the sprucest results of tree condition analysis based on maps of parameters developed through the ICP Forests monitoring of over three years (2008 – 2010).
Cartographic methods allowed assessing spatial trends of change in condition of tree plants and identifying the causes and effects between monitoring indicators and landscape characteristics as well as the sources of human-induced impact. This paper was based on the CEPL RAS reports in the field of Development of Scientifically Substantiated Proposals for Criteria and Indicators of Forest Attenuation Based on the Results of Forest Pathology Monitoring Provided under International Standards to Assess Performance in the Field of Forest Relations, GK R-9K-11/3 (Report…, 2011, Report…, 2012).
CharacteristicS of monitoring objects
Three large forest zones are distinguished in the Russian Northwest: tundra forests and open taiga, taiga zone (north, middle and south taiga), and mixed coniferous and wide-leaved forests. Low and high platform plains dominate among landscapes. The highest groups of landscapes are encountered in Murmansk Region (Khibiny Mountains) and in the northern part of Karelia; the lowest landscapes can be found in Kaliningrad Region. Figures 1 and 2 represent the landscape map with dominant tree species in POP and forest regions with a POP network by regions. The legend to landscape map (by A.G. Isachenko, Environmental Atlas of Russia, 2002) is provided in Table 1.
The north taiga forests occupy 23% of Murmansk Region; forest and tundra birch open woods occupy about 50% of it. Forests grow on elevated pediment plains and in low accumulative glaciolacustrine and lake plains. Undulated and morainic landscape predominates in the southern part of Murmansk Region. A significant part in the western and central parts of the region is occupied by wrinkled-block and block mid-mountain landscapes characterised by a prominent structure of high landscape differentiation. Swamps of various types are common in the area.
Most part of the Republic of Karelia is occupied by ridge-and-hill lake plains whose altitudes are decreased from west to east. Morainic undulating and lake-and-glacier sand plains are widely spread in the terrain, with frequently occurring outcrops of crystalline rocks. The southern part of the region is characterised by alternation of undulating swampy plains with ridges and hills. The boundary between the north and middle taiga forests goes approximately at the level of Lake Segozero. The north taiga is dominated by pinewoods, while the middle taiga is dominated by pinewoods with spruce woods. Sphagnum pinewoods primarily grow in poor soils of swampy plains and swamps, while moss pinewoods grow in higher parts of the plains. Moss spruce woods (sometimes with birches and aspens) predominate among spruce woods, which grow on the richest soils.
The area of Leningrad Region is mostly plain with insignificant absolute elevations. The area of the Karelian Isthmus is a part of the Baltic crystalline shield marked by broken ground, multiple rock outcrops and large number of lakes. Lowlands are primarily located on the banks on the Gulf of Finland and Lake Ladoga as well as in the dales of large rivers. Vegetation of landscapes is represented by boreal south taiga forests, with middle taiga forests located in the north-eastern part of the region. Transition from coniferous forests to mixed forests is found in the south. Forests occupy about a half of the region’s area. This area is peculiar for having been developed by humans for a long time, which resulted in strong depletion of forest resources. Indigenous pine and especially spruce woods partially remained in the north-western and eastern parts of the region, but are primarily replaced by derived small-leaved forests and underwood (birch, aspen, grey alder). A significant place in the vegetation cover of the area is occupied by swamps, predominantly of raised type.
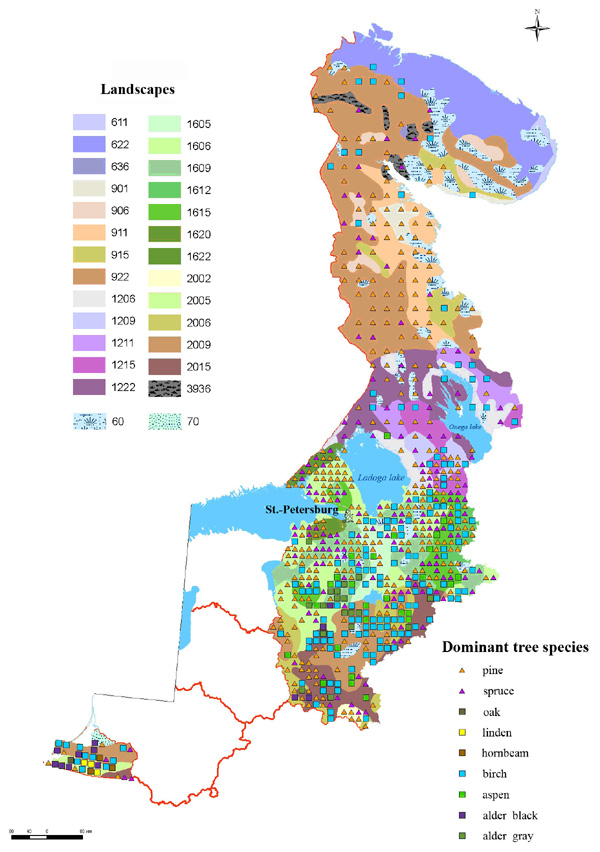
Figure 1. Dominant tree species in a POP and landscape types
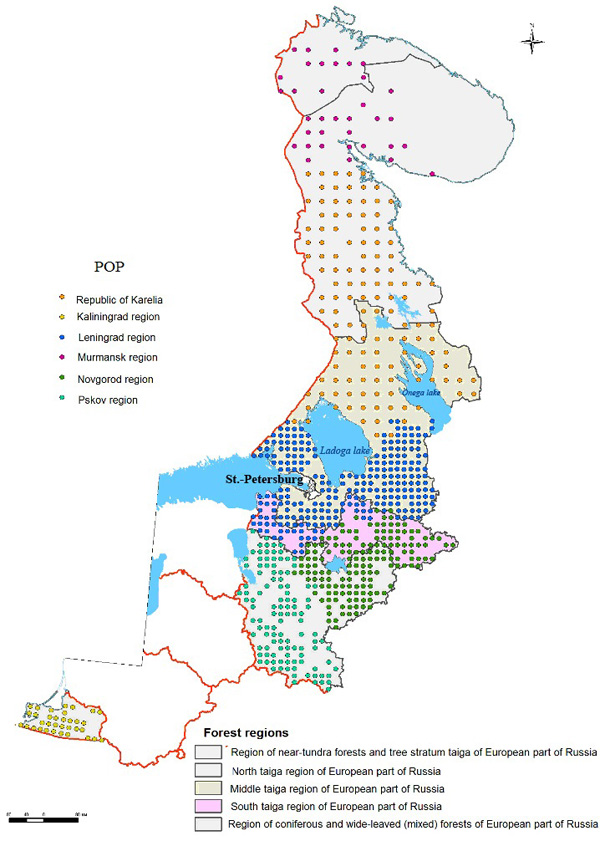
Figure 2. POP distribution by regions of the Russian Northwest with forest area boundaries
The area of Novgorod Region represents a low flat lake-and-glacier and ancient alluvial plain with small areas of hilly and morainic terrain. Primary forms of terrain are vast outwash swampy plains. By its landscape, Novgorod Region is divided into plain western part and high eastern part. In the north of Novgorod Region, south taiga trees grow while sub-taiga coniferous and wide-leaved (mixed) forests predominate in the central and southern parts of it. Birch and pine predominate in the mixed forests of the south taiga. Significant species of coniferous and wide-leaved (mixed) forests are mainly represented by secondary aspen and birch forests with wide-leaved species like linden, maple, and oak.
Table 1. Legend to landscape map by A. G. Isachenko (Environmental Atlas of Russia, 2002)
|
Landscapes |
|
|
Subarctic forest-tundra landscapes of Eastern Europe |
|
|
611 – 622 – |
pediment plains on crystalline rocks of Precambrian shields with glacier expressions of landscapes of low platform plains Precambrian shields and ridges on disturbed Palaeozoic and Proterozoic rocks with glacier expressions of landscapes of high platform plains |
|
Boreal north taiga landscapes of Eastern Europe |
|
|
901 – 906 – 911 – 915 – 922 – |
accumulative marine sand and sand-clay; arid sand salinised landscapes of low platform plains lake-and-glacier sand landscapes of low platform plains pediment plains on crystalline rocks of Precambrian shields with glacier expressions of landscapes of low platform plains hill-morainic and kame (in the area of Late Quaternary glaciation) landscapes of high and platform plains Precambrian shields and ridges on disturbed Palaeozoic and Proterozoic rocks with glacier expressions of landscapes of high platform plains |
|
Boreal middle taiga landscapes of Eastern Europe |
|
|
1206 – 1209 – 1211 – 1215 – 1222 – |
lake-and-glacier sand landscapes of low platform plains morainic (in the area of Late Quaternary glaciation) landscapes of low and platform plains pediment plains on crystalline rocks of Precambrian shields with glacier expressions of landscapes of low platform plains hill-morainic and kame (in the area of Late Quaternary glaciation) landscapes of high and platform plains Precambrian shields and ridges on disturbed Palaeozoic and Proterozoic rocks with glacier expressions of landscapes of high platform plains |
|
Boreal south taiga landscapes of Eastern Europe |
|
|
1605 – 1606 – 1609 – 1612 – 1614 – 1615 – 1620 – 1622 – |
lake-and-glacier clay and loamy landscapes of low platform plains lake-and-glacier sand landscapes of low platform plains morainic (in the area of Late Quaternary glaciation) landscapes of low and platform plains outwash (low and high) landscapes of low platform plains morainic, morainic-erosive, ice-marine (in the area of Middle Quaternary glaciation), landscapes of high and platform plains, frequently with clay loam mantle hill-morainic and kame (in the area of Late Quaternary glaciation) landscapes of high platform plains karst plateau on limestones, dolomites and gypsum of high and platform plains Precambrian shields and ridges on disturbed Palaeozoic and Proterozoic rocks with glacier expressions of landscapes of high platform plains |
|
Boreal low taiga landscapes of Eastern Europe |
|
|
2001 – 2002 – 2005 – 2006 – 2009 – 2015 – |
accumulative marine sand landscapes of low platform plains ancient alluvial, lake-alluvial and lake clay and loamy landscapes of low platform plains lake-and-glacier clay and loamy landscapes of low platform plains lake-and-glacier sand landscapes of low platform plains morainic (in the area of Late Quaternary glaciation) landscapes of low and platform plains hill-morainic and kame (in the area of Late Quaternary glaciation) landscapes of high platform plains |
|
Boreal dark coniferous open wood landscapes |
|
|
3936 – |
wrinkled-block and block landscapes of wrinkled and block mountains (on Palaeozoic and Precambrian formations penetrated by intrusions) |
|
Hydromorphic systems |
|
|
60 – 70 – |
swamps river dales and deltas |
The terrain of Pskov Region is formed by the Valday icecap and consists of terrain forms differing in their area and origin. Lowlands and highlands are the largest landforms. A dominant position in the terrain is preserved by lowlands that represent a system of gently undulating morainic and flat undulating lake-and-glacier plains. Pskov Region is located in two subzones of the forest zone: south taiga and coniferous and wide-leaved forests. The south taiga zone mostly has moss grass and shrub woods and their derivative small-leaved forests. Pinewoods account for the most part of the local woods and occupy sand and sandy-loam soils of outwash plains, kames, and asars. Spruce forests are small in number and mainly occur in the north of the region. Small-leaved forests of birch, aspen, black and grey alder are of secondary origin. They occurred in place of exterminated spruce and pine forests. The coniferous and wide-leaved forest subzone has nemorose and grass forests, partially with wide-leaved underwood and singular admixture of wide-leaved species in the forest stand.
The landscapes of Kaliningrad Region formed due to the most recent Valday glaciation and show systematic alternation of vast plain and low spaces with individual hilly and ridge highlands. The north-eastern part of the region is occupied by a glaciolacustrine plain where individual hills are found. A hilly and morainic ridge is attached to the plain from the west with a large arch across the entire region. The north-eastern part of the region has a lake-and-glacier lowland whose individual areas are below the Baltic Sea level, which also causes swamping. The region’s vegetation cover belongs to boreal sub-taiga landscapes and represented by coniferous and wide-leaved (mixed) forests. Primary forest forming species are spruce, pine, oak, male, and birch. Spruce is common in forest areas of eastern parts of the region and occupies 25% of the forest area. Pine forests occupy about 17% of the forest area in the region. Oak forests are represented by individual small areas with European oaks, aspen and linden forests also encountered. There are small areas of beech forests. Up to one-fourth of the forest areas are occupied by birch forests. Low areas of soils with long-term excessive moisturizing are occupied by black alder.
SAMPLES and procedures
Ground studies of tree plants were conducted visually and instrumentally using a standard methodology of ICP Forests on the regular monitoring network. Network nodes have POP representing clusters of four accounting points equally distanced from the POP center in any direction. At least six trees of a dominant species were selected in each subplots (24 trees per POP) along with trees of other species located closer than the sixth tree to the middle of the subplot. Thus, up to 50 examined trees could be in a single POP (Methodological guidelines…, 2009). Table 2 represents the number of POP by regions (with numbers of examined trees indicated in brackets) where observations were made over the three years. Since new POP were established every year during initial monitoring (and not all existing POP were covered by annular observations), their number changed respectively.
Table 2. No. of POP with ground observation for 2008-2010
|
Regions |
2008 |
2009 |
2010 |
|
Murmansk |
0 |
35 (985) |
35 (991) |
|
Republic of Karelia |
129 (4.093) |
47 (1.582) |
48 (1.609) |
|
Leningrad |
155 (4.473) |
145 (4.246) |
97 (3.025) |
|
Novgorod |
126 (3.658) |
36 (1.065) |
45 (1.328) |
|
Pskov |
68 (1.994) |
68 (2.019) |
29 (913) |
|
Kaliningrad |
34 (1.144) |
34 (1.120) |
34 (1.126) |
|
Total |
512 |
365 |
288 |
In order to obtain the dynamics of tree species indicators on the monitoring network, an attributive database was created in MySQL to assess crown condition and damage of tree plants. MySQL represents a high-performance multi-user DBMS built using client/server architecture and provides an opportunity to divide resources and provide access to the database server over a network. To organise MySQL operation, a server was used, which allows working with data both from a local network and via Internet.
Tables for condition of forests and forest formation factors have been developed in accordance with the data structure. The relational data model used to build the information system database technically represents a set of tables interrelated by key fields. A single table corresponds to any specific class of objects (POP, model trees, tree species) or parameter (list of protection categories, age of damage). The database includes fifteen guides and eleven operational tables. The database is based on three operational tables: POP description, model trees and crown condition. The first table is filled in with all parameters belonging to POP and forest organization allotment where this plots is installed, while two others are filled in with constant tree characteristics (species, number) and annually defined parameters (Eydlina, Knyazeva, 2014).
First level monitoring indicators suggesting annular observation of model trees in POP include two groups: assessment of crown condition and description of indications and damage. Assessment of crown condition includes parameters of defoliation, discoloration and category of sanitary condition.
Defoliation means premature fall of leaves or spruce needles due to unfavourable environmental factors. Defoliation is estimated as percentage relative to the fully leaved tree. The following classes are distinguished with the range of 5% (0–5, 5.1–10%, etc.).
Discoloration means change in colour of leaves or spruce needles due to human-induced or natural impact. Discoloration level is ranged from 0% to 100% with the range of 5%.
Category of sanitary condition means an integral scoring of condition of trees using a number of visual indications. When selecting trees for annular examination in POP, only trees with category of sanitary condition of 1 to 3 were selected where category 1 meant tree plants with no signs of weakness, category 2 meant weak trees, and category 3 meant extremely weak trees.
To describe indications and damage of trees, the following parameters were assessed in POP: damaged part of the tree, damage symptom, symptom specification, age of damage, cause and damage extent.
The operational tables are interrelated by three key fields: a unique component code of POP, model tree ID and model tree description ID. Guides are associated with operational tables by key fields with unique codes. The DBMS provides samples using respective queries and converts data into formats suitable for further cartographic representation of spatial data in the GIS software.
For cartographic assessment of tree condition, electronic maps were made that displayed ICP Forests monitoring indicators for each year of observations and maps of parameters over a three-year period. The maps were created based on a vector point layer with POP coordinates and attributive tables with indicator values obtained from MySQL 5.2 ICP Forests. A source of spatial information to create a vector landscape layer was the landscape map (by A. P. Isachenko) 1:7000000 (Environmental Atlas of Russia, 2002). Mapping included spatial analysis procedures that comprised the study of location, associations, neighbouring and other spatial relations between events and objects. The DBMS tools calculated values of characteristics of dominant tree species for each POP. Using a unique code including the region code and POP sequential number, attributive tables and vector layer were aligned (associated) with POP coordinates (Knyazeva, Eydlina, 2013). Using procedures of SQL-queries and applying compliance conditions of objects to selected attributive parameters and spatial criteria to software criteria, ArcGIS tools provided a series of thematic maps of parameters like crown condition of dominant tree species in POP (defoliation, discoloration, category of sanitary condition), share of damaged trees of dominant species in POP, and occurrence of most dangerous causes of damage in trees of dominant species in POP. The maps were made for six Russian regions (Leningrad Region, Pskov Region, Novgorod Region, Kaliningrad Region, Murmansk Region, and the Republic of Karelia) for every year of observation.
To assess temporal and spatial change in characteristics of crown condition of dominant tree species in POP, a number of maps of parameters were made to reflect the dynamics of indicators for each period of 2008-2009, 2009-2010, and 2008-2010: the dynamics of average values of defoliation; the dynamics of average values of discoloration; and the dynamics of average values for categories of sanitary condition. The maps were made for 190 POP located in five Russian regions: Republic of Karelia, Leningrad Region, Kaliningrad Region, Pskov Region, and Novgorod Region (POP in Murmansk Region were installed in 2009 only). To calculate average values of indicators over the years, only those trees of dominant species were taken into account whose condition was assessed every year. Thus, the accuracy of dynamics analysis of average values of ICP Forests monitoring indicators using maps was ensured by complying with conditions for using the same unique POP identifiers and trees on these POP for all periods. When analysing the dynamics of indicators, the defoliation values below ±5% and discoloration values below ±10% can be neglected, since the variety of values in those ranges may be compared to accuracy of indicator measurement.
For cartographic imaging of POP characteristics having point localization, the icon method was selected. The icons were created using the library of symbolic conditional icons of ArcGIS (Tretchyachenko, 2009). Quality indicators like dominant species of trees were displayed on the maps with icons of various shape and colour: an icon shape indicated a group of coniferous forests or hardwoods and an icon colour defined the tree species. Quantitative indicators (age, defoliation, and discoloration) were represented by dimensional icons of the same shape with a proportional range of a specific indicator value. Value ranges were selected as per assessment methodology for the corresponding indicators in ICP Forests Manual. When developing analytical maps of quantitative parameters, methods of natural boundaries and equal intervals were used. Clarity of cartographic imaging was achieved by colour means as well: as quantitative indicators grow in value, not only the icon size but the colour intensity increases too. Ranges and their respective designations are similar to same-type indicators for various years so they can be easily assessed on the maps.
The dynamics shown by icons was as follows: icon size reflected difference of average values of the indicator for two dates, and the icon colour showed a dynamics trend (increase or decrease) of the indicator from the previous year to the next one. Red shades of the icon colour indicated negative trends: an increase of defoliation and discoloration values, values as compared to the previous year, and impaired category of sanitary condition. For quantitative indicators of dynamics, a progressive scale with an increase of the value range was used.
STUDY Results and discussion
The temporal dynamics of condition of tree plants by regions and that of spatial interrelations with landscape conditions of forest vegetation and human-induced impact was identified by analysing a series of asynchronous maps of parameters and maps of dynamics.
A high degree of crown defoliation was noted in pine trees forming north taiga forests on accumulative marine and sand landscapes of low platform plains (17%), middle taiga forests on Precambrian shields and ridges of high platform plains (15%) and south taiga forests on glaciolacustrine sand and morainic landscapes of low platform plains (15% each). For spruce and birch, a high degree of defoliation (16% and 15%, respectively) must be noted in middle taiga forests on morainic landscapes of low platform plains and in south taiga forests on karst plateau on limestones, dolomites and gypsum of high platform plains (16% and 21%, respectively).
The dynamics analysis of average estimates of defoliation of dominant tree species in POP shown that discoloration average is below 5%. Most frequent values of discoloration were 0–5 % and 5–10 %. Spruce and pine discoloration degree was significantly lower than defoliation and averagely reaches 7–9%. An increased degree of discoloration of pines of sub-taiga forests on glaciolacustrine clays and loamy landscapes of low platform plains must be noted: to 16% in 2009, and to 25% in 2010, respectively. The birch discoloration degree reached 13% in north taiga and middle taiga forests that grow on crystalline plains as well as in middle taiga forests that grow on undulating morainic and kame soils of high platform plains.
Distribution of trees of major forest-forming species by categories of condition in the entire network showed that the share of healthy trees in the monitoring network varied from 75% to 80%, the share of weak trees is 14 to 20%, and the share of extremely weak trees is 3 to 6% (Lukina et al., 2013). The share of POP with the weak category of sanitary condition was below 22%, two-thirds of which represented pine forests and one-third of which represents spruce forests. The number of POP with the extremely weak category of sanitary condition was below 3-4 in various years. Most POP was concentrated in middle taiga. POP with dominant spruce stratum belonged to morainic landscapes of low platform plains, and POP with dominant pines belong to Precambrian shields and ridges of high platform plains. Most POP was marked by stable condition of trees over 2008-2010. The total number of damage caused by biotic and abiotic factors in the entire network areas by years was 6,781 in 2008, 5,556 in 2009, and 7,052 in 2010. The share of damaged dominant tree species was averagely 35–40%. The indicator changed by regions from 12% to 40% for pine, 11% to 31% for spruce and 17% to 30% for birch. Primary causes of damage were fungous diseases, insects as well as abiotic factors.
Let us consider the detailed change in condition of dominant tree species in POP in the monitoring system for each region.
Murmansk Region
No examinations of tree condition were conducted in 2008. In 2009-2010, an examination using the ICP Forests international methodology was conducted in 35 POP. In 2009, most POP (60%) showed the average defoliation of crowns of dominant tree species below 5% (Fig. 3B). Maximum values reached 23–27% on two POP only. In 2010, the number of POP with trees whose defoliation degree exceeded 5% was half of the total number of POP, and defoliation values also increased a little, averagely by 2–5% (Fig. 3C). However, the maximum values of defoliation decreased to 19%. Only one POP was located near a large source of industrial emissions, the Monchegorsky ore mining and processing enterprise, with a low value of defoliation of trees (about 10%). Predominant trees of POP were represented by averagely 57 years old spruce trees. It was possible that, as POP were arranged in 2009, the trees of older age were in poor condition and were excluded as monitoring objects under the methodology. Therefore, despite a high level of air and soil contamination in the suburbs of Monchegorsk, defoliation indicators of tree plants were low. A denser network of POP is required in the areas with concentrated industrial enterprises and vehicles that are main sources of emissions to analyse the impact of air contamination on the condition of tree plants.
Average discoloration values of crowns of dominant tree species in POP of the region during 2009-2010 were low: below 25% in 2009 and 15% in 2010 (Fig. 5C). In 2009, average discoloration values in six POP exceeded 10%, with only two POP remaining in 2010. A trend of decreasing maximum average values of discoloration can therefore be noted along with a decreasing number of POP with the maximum discoloration values.
There were no POP with the extremely weak condition of tree plants in Murmansk Region (Fig. 6 A, B). In 2009, almost 70% of POP in the region indicated damage in dominant tree species (Fig. 7B). The number of damaged trees in seven POP exceeded 80% of the total number of dominant tree species. The number of POP in 2010 with a half of damaged trees increased by 30%. (Fig. 7C). In general, the total number of damaged trees in 2010 increased 1.5 times as compared to the previous year; the number of examined trees remained almost unchanged. Most diseases (about 25%) were caused by abiotic factors; fewer diseases (15–20%) were caused by fungous diseases and insect pests. POP with the trees damaged by most dangerous diseases (blister rust, pine fungus) and insects (European spruce bark beetle) in the region in 2009 were not found, only one case of blister rust was identified in 2010 in a single POP.
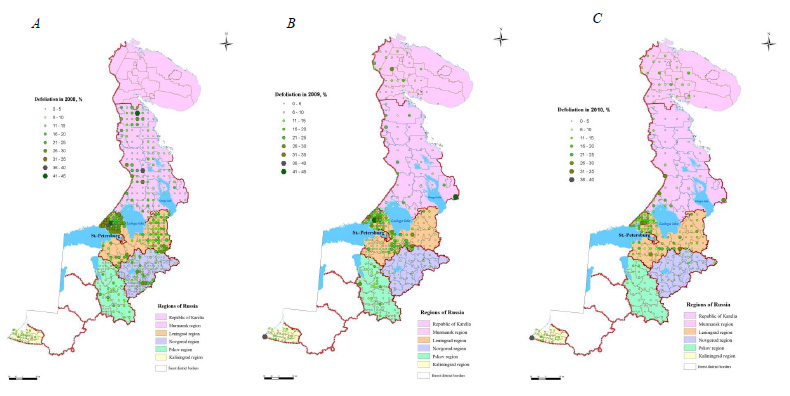
Figure 3. Average values of crown defoliation in dominant tree species in POP: А – 2008, B – 2009, C – 2010.
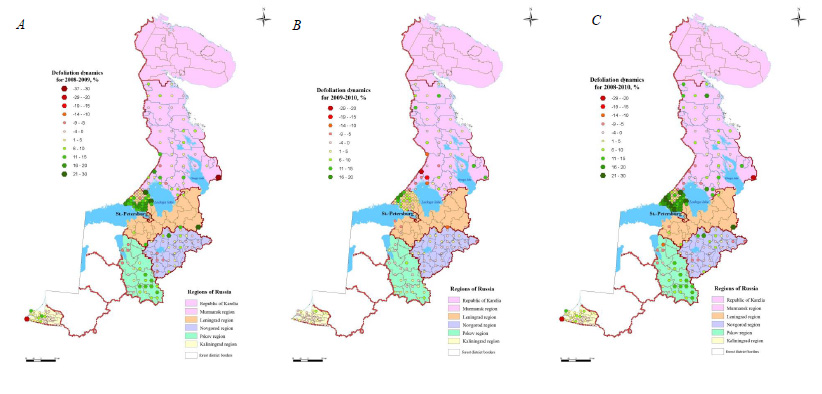
Figure 4. Dynamics of average values of crown defoliation in dominant tree species POP: А – 2008-2009, B – 2009-2010, C – 2018-2010.
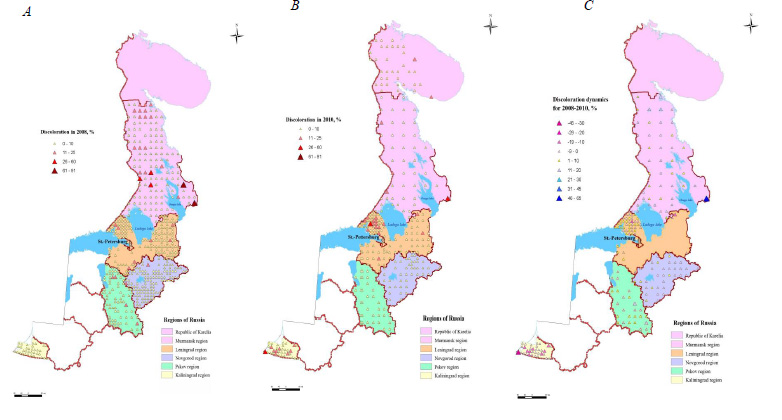
Figure 5. Average values and dynamics of crown discoloration in dominant tree species in POP: А – 2008, B – 2010, C – 2008-2010.
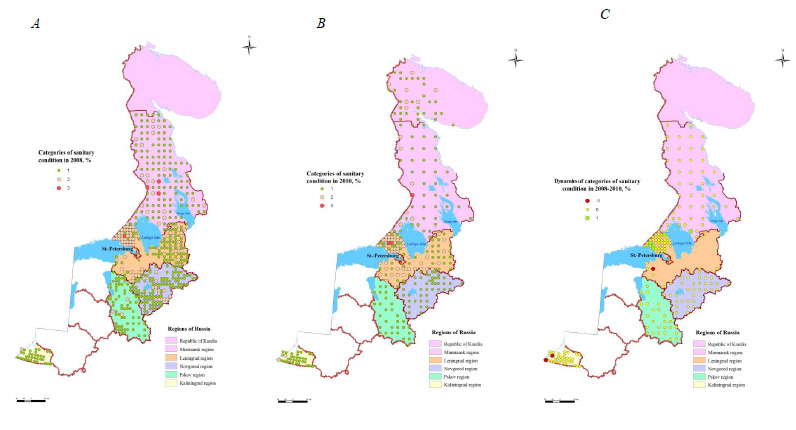
Figure 6. Average values and dynamics of crown condition category in dominant tree species in POP: А – 2008, B – 2010, C – 2008-2010.
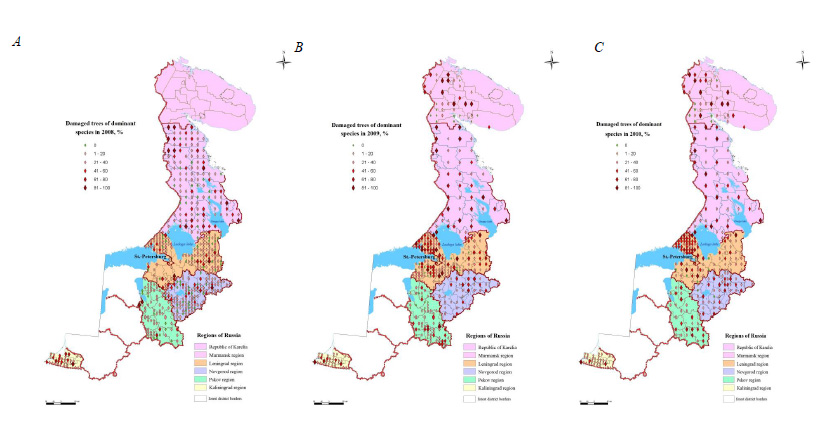
Figure 7. Share of damaged trees of dominant species in POP: А – 2008, B – 2009, C – 2010.
Republic of Karelia
The totals of 129 POP were examined in 2008. Most POP showed the average defoliation of dominant trees below 15%. However, there were groups of POP in the north of Karelia and in the middle to western part (Muyezerskoye and Suyarovskoye forest districts) with rather high defoliation of 21% to 45% (Fig. 3A). Dominant species of pines aged 120-180 grow in those POP. Landscapes are represented by low and high platform plains (Precambrian shields and ridges with glacier expressions).
Field examinations in 2009-2010 were carried out for 47 POP. In POP where maximum defoliation was found in 2008, no examinations were carried out. In 2009, the maximum values of defoliation degree (41%) were found in POP No. 558 located in the south-eastern part of Karelia with dominant birch young trees, and high defoliation of leaves was caused by an outburst of birch-mining moth (of the family Eriocraniidae). Maximum values of defoliation sank to 28% in 2010. Average defoliation in 2009 and 2010 in most POP of the republic was below 10% (Fig. 3B, C). In 2010, high defoliation (above 15%) was found in POP located in the south-western part of the region where spruce and pine above 100 years old are dominant. The dominant type of landscape is Precambrian shields and ridges on disturbed Palaeozoic and Proterozoic rocks with glacier expressions of high platform plains.
High discoloration of crowns of dominant tree species (within 15–30%) were found in 2008 in the same POP where high defoliation was observed (Fig. 5A). Dynamics analysis of average defoliation in POP over three years showed no significant fluctuations of this indicator within the most part of the republic. The north of Karelia in the Loukhsky forest district and the south (Pryazhinskoye and Olonetskoye forest districts) showed positive dynamics: defoliation decreased from 2008 to 2010 averagely by 15% (Fig. 4). Change in average discoloration over 2008-2010 was found in some POP in the northern part of Karelia in the Loukhsky forest district): discoloration decreased by 10–20% in average (Fig. 5C).
There were few weak trees in Karelia in 2008, but Muyezerskoye and Suyarovskoye forest districts in the western part of the region had three POP where extremely weak trees grow (Fig. 6A). Those were pine tree stratum with crown defoliation of 30% to 40% and discoloration of up to 60%. The Loukhsky forest district in the northern part of the region had a group of POP with weak trees where POP No. 39 had one of the highest defoliation shares in 2008, namely 43% (Fig. 6A). No POP with the extremely weak category of sanitary condition was found in 2009 in Karelia. The number of POP with weak trees reduced more than twice as compared to the previous year. However, this was related not only to the improved sanitary condition of tree plants but also to a greater cell size of examined POP. In 2010, the sanitary condition of trees in POP No. 369 aggravated again (category of extremely weak trees). Primary changes in categories of sanitary condition were identified in POP located in the south-western part of Karelia. The dynamics of that indicator in all POP was multidirectional: while the category of condition improved in four POP (Nos. 369, 485, 538, 636) in 2008 to 2009, it fell by one point during 2009-2010 in POP Nos. 369, 485, and 538. Thus, change was identified in a single POP during 2008-2010 (Fig. 6C).
No damage of trees of dominant species was found in 2008 in 13% of the POP. Most POP with above 80% of damaged trees was concentrated in the northwest of Karelia and in its south-eastern part (Fig. 7A). Tree damage was found in all POP in 2009 and 2010 (Fig. 7B). Most identified damage in 2010 was caused by insects (42%). As compared to the previous years, the relative number of tree damage by fungi increased, and the share of damage caused by abiotic effects decreased. In general, the total number of damage related to the number of examined trees over 2008-2010 grew each year 1.5 times with 44% in 2008, 103% in 2009, and 166% in 2010). The share of POP where blister rust was found in trees was 12% in 2008, 19% in 2009, and 20% in 2010. Most POP of the kind was located in the central eastern part of the region in the Belomorskoye and Segezhskoe forest districts.
Leningrad Region
Examinations of 155 POP located in the eastern and north-western parts of the region were carried out in 2008. The central and south-western part of the region was almost not examined, except for some single POP. Average defoliation of tree crowns of dominant tree species was rather high – it exceeds 15% for most POP. Maximum defoliation (above 25%) was found in POP located in the north-western part of the region on the Karelian Isthmus and in the farthest south-eastern part (Fig. 3A). Average discoloration of crowns in POP in 2008 was low, primarily below 10% (Fig. 5А). Dominant species were represented by 80-120 years old pines in most POP. Outwash and morainic landscapes of low platform plains and Precambrian shields and ridges with glacier expression of high platform plains are widely spread on the Karelian Isthmus. One of the primary sources of air contamination is located in the city of Primorsk (Primorsk Trade Port, Spetsmornefteport Primorsk). A dense network of federal highways towards Finland is also found there. Field examinations in 2009 and 2010 were undertaken more evenly along the entire region. Maximum defoliation was found on the Karelian Isthmus as in 2008: 20% to 45%. High defoliation of tree stratum was found in POP in the central part of the region: 15-35% (Fig. 3B, 3C). Average discoloration in 2009 and 2010 for most POP was within 0% to 10% but the number of POP with crown discoloration above 10% almost doubled (Fig. 5B). Highest discoloration of tree stratum crowns (15–23%) was found in the same POP that had high defoliation. Tree stratum was dominantly represented by pines of various ages growing in glaciolacustrine and morainic low plains. It is possible that the impact on crowns of the local forests was caused by large sources of industrial emissions in the town of Kirishi like the enterprises of Kirishi Petroleum Organic Synthesis and Kirishi Power Station. Due to uneven annual examinations in the POP network of the region, the dynamics analysis of average defoliation values was possible on the Karelian Isthmus only. Positive dynamics was noted in most POP of the Karelian Isthmus in 2008-2009: defoliation decreased by 10–20% (Fig. 4A). The average defoliation level decreased in 2009-2010 in the POP located along the Finnish border but remained the same in the other parts of the isthmus (Fig. 4B). In general, a significant reduction of defoliation was recorded in 2008-2010, averagely by 15% (Fig. 4C). Nevertheless, defoliation of tree plants in POP of the Karelian Isthmus remained one of the highest in Leningrad Region.
About half of the trees in POP in Leningrad Region in 2008 remain in weak condition (Fig. 6A). Most POP showed the share of damaged trees of dominant species below 40%. Only two POP showed more than 80% of damaged trees (Fig. 7A). Primarily, weak trees belonged to coniferous species of ripe and ripening age. Most POP with the weak category of condition were concentrated on the Karelian Isthmus.
The sanitary condition of tree stratum aggravated in 2009. The trees were qualified as healthy in one POP only and found extremely weak in four POP. More than half of damaged trees were found in 38% of the POP. The Karelian Isthmus showed aggravation: all POP had damaged trees, with their share exceeding 50% in half of them. Most damage was recorded in POP located in the western part of the region (Fig. 7B). Quite a high number of POP with weak trees was found in the central part of the region in the Kirishi, Kirovsky and Lyubansky forest districts. The weakest trees were represented by coniferous species aged 65-120 years and older.
Minor positive dynamics was observed in 2010 for the category of sanitary condition in POP of the Karelian Isthmus: trees were acknowledged healthy in 14 POP, and only two POP had weak trees (Fig. 6B). The maps of parameters clearly showed that multidirectional process by years, but, in general, moderate positive dynamics was found in 2008 to 2010 in the condition of tree stratum on the Karelian Isthmus (Fig. 6C). The dynamics of healthy/damaged tree ratio in POP was gradually becoming negative. In 2010, 80% of POP on the Karelian Isthmus had more than 50% of damaged trees (Fig. 7). Due to most dangerous causes of tree damage for 2008-2010, blister rust was found in the north-western part of the region (primarily damaging the coniferous trees). No dangerous causes of damage were found in most POP.
Novgorod Region
Ground examinations were undertaken in 2008 along the entire area of the region in 126 POP. High defoliation was found in POP located in the central and south-eastern part of the region (Fig. 3A). This area shows glaciolacustrine and morainic landscapes of low plains, hill-morainic and kame landscapes of high plains. Maximum defoliation was below 27%. Field examinations in 2009 and 2010 were evenly undertaken along the entire area but with a thinner network of POP: 36 and 45 POP, respectively. In 2009 and 2010, average defoliation did not exceed 15%, and most POP showed only 10% (Fig. 3B, C).
Since POP where maximum defoliation had been recorded in 2008 were not examined in 2009 and 2010, the analysis of defoliation time dynamics over 2008-2010 was not representative. However, the maps of parameters shown that primary changes in indicators took place in 2009: average defoliation reduced by 10-20% in the northern part of the region and slightly increased by 5–10% in the south-west (Starorusskoye forest district) (Fig. 4B). It took two years for gradual and small increase in defoliation (5–10%) in the east of the region in the Moshenskoye and Pestovskoye forest districts (Fig. 4C).
Average values of crown defoliation in dominant tree species were small. Only POP No. 26 had discoloration above 10% in 2008. In 2009 and 2010, average discolorations of crowns of dominant tree species were below 10% (Fig. 5A, B).
The share of POP with weak trees was 11% in 2008; the trees were located rather compact on the stripe extended in the meridional direction, in the central part of the region (Fig. 6A). All POP in 2009 and 2010 belonged to the category of healthy sanitary condition. Average defoliation and discoloration of crowns of dominant tree species were also the lowest – below 10%. No changes of sanitary condition of dominant tree species in POP were recorded on the maps of parameters for 2008-2010 (Fig. 6C). This is related to the fact that POPs having the weak category of sanitary condition in 2008 were not examined in the following years and therefore not represented on the maps. Since various number of POP were examined every year, it was hard to make a conclusion on the share of damage in POP; a conclusion can be made for most examined POP that the share of damaged trees of dominant species has slightly and gradually increased (Fig. 7).
Pskov Region
Examinations were undertaken along the entire area of the region; however, while only 68 POP were examined in 2008 and 2010, their number dropped to 29 in 2010. Annual examinations over 2008-2010 were undertaken in 25 POP. Average defoliation in 2008 in most POP was below 15%. Only in two POP located in the Opochenskoye forest district, the defoliation rate was 21% (Fig. 3A). Average crown discoloration exceeding 10% was recorded in four POP of the region (Fig. 5A). Average defoliation in 2009 was below 15% (Fig. 3B). The situation aggravated for discoloration: in 12 POP, crown discoloration of dominant species exceeded 10%, being 30-35% in two POP. High defoliation of 11-30% was noted for those POP. The POPs are primarily located in the Pechorskoye and Porkhovskoye forest district in the central part of the region. Average defoliation in POP in 2010 was significantly below 10%, crown discoloration in all POP was low (below 8%). Maximum defoliation was found in the northern part of the region (Fig. 3C, 5C). It should be noted that POP where high defoliation was recorded were examined for 2008 to 2010 only once and therefore there has been no dynamics analysis. Primary changes of defoliation indicator on 25 POP took place in 2009: defoliation decreased by 10-20% in the south-eastern part of the region while the defoliation of tree crowns increased by 5-10% in the north-western part of the region (Fig. 3C). Defoliation fluctuated in 2009-2010 within 5%; in other words, it remained almost unchanged (Fig. 4C). The discoloration dynamics was insignificant, since average values by years changed within 0–10% (Fig. 5C).
Only 4% of POP in 2008-2009 had trees with a weak category of condition (Fig. 6A). All POP examined in 2010 belonged to the healthy category of sanitary condition (Fig. 6B). No change in sanitary condition of trees of dominant species in POP was recorded on maps of parameters for 2008-2010 (Fig. 6C) except for one. This is explained by low popularity of POP examinations and peculiarities of calculating average values of the indicator (rounding off to integers).
In 2008, most POP showed the share of damaged trees below 40%, with no damage of trees of dominant species found in 15% of POP (Fig. 7A). In 2009, the number of POP with tree damage slightly increased. That was especially distinct in the southern part of the region (Fig. 7B). In 2010, all examined POP showed tree damage (Fig. 7C). The ratio of detected damage to the number of examined trees changed from 20–28% in 2008-2009 to 59% in 2010.
Kaliningrad Region
Annual examinations over 2008-2010 were undertaken in 34 POP in Kaliningrad Region. In 2008, average defoliation for most POP was below 10%, while eight POP showed defoliation within 11–15% (Fig. 3A). In 2009, the average indicators almost did not change, except for POP No. 8 in the Bagrationovskoye forest district in the far southwest where defoliation increased to 38% (Fig. 3B). In 2010, defoliation of trees in the said POP remained high with 37% (Fig. 3C). Mostly pines aged 90 grow in POP No. 8 on glaciolacustrine clay low plains. For 2009-2010, defoliation in most POP remained almost unchanged (Fig. 4B).
Gradual minor aggravation of crown condition expressed by discoloration indicators can be noted for POP of Kaliningrad Region. In 2008, there was almost no crown discoloration of dominant tree species in POP, and only three POP had verge discoloration within 1-5% (Fig. 5A). In 2009, discoloration was 34% in one POP (No. 8) (defoliation was also high with the ratio of 38%). In 2010, crown discoloration in nine POP exceeded 10% with 46% in POP No. 8 (Fig. 5B). The negative change in discoloration was well noted on the maps of parameters for discoloration (Fig 5C). The sanitary condition of trees in POP remained stable for the entire period of observations: only two POP showed weak trees (Fig. 6).
In 2008-2010, all POP in the region showed damage in trees of dominant species. In 2008, 32% of POP indicated damage of most trees (above 50%). Most damage was recorded in the northern and western parts of the region (Fig. 7A). In 2009, the number of POP with damaged trees above 50% reduced to 18%, and remained at 9% in 2010 (Fig. 7B). By 2010, the situation in the Slavskoye forest district improved significantly in the northern part of the region: no more than 20% damage of trees of dominant species was found in POP (Fig. 7C). Only POP No. 8 (where maximum values of defoliation and discoloration were found), showed more than 80% of damaged trees. Most dangerous causes of damage in the region included only blister rust (in 2-3 POP). In general, we can conclude of a gradual decrease in total number of damaged trees and of POP with the highest degree of damaged trees.
Conclusion
Analysis of maps of parameters for tree species condition for 2008-2010 showed that permanent observation plots with tree species differing in the highest level of defoliation were concentrated in the middle taiga forests in Leningrad Region, primarily the Karelian Isthmus. Primarily coniferous species grow there. Their age was 80 to 190 years. Spatial proximity of POP with high defoliation to large sources of industrial atmospheric emissions can be noted for the entire Leningrad Region. In 2008, the highest discoloration was found in the Republic of Karelia while, in 2009, the highest number of POP with highest discoloration level was found in Murmansk Region, Leningrad Region, and Pskov Region. In 2010, the maximum discoloration was found in POP of Leningrad Region and Kaliningrad Region.
Most trees of dominant species in POP of the monitoring network were healthy. Sanitary condition of trees in POP for 2008-2010 varied from healthy to extremely weak only in two regions (Republic of Karelia and Leningrad Region). In most POP, for 2008-2010, the category of condition did not change. Primary change in this indicator was associated with the Karelian Isthmus in Leningrad Region and the southern part of the Republic of Karelia. POPs with both negative and positive trend related to the category of condition are located there. In general for all regions, the weakest tree plants in POP belonged to coniferous species above 80 years old. The number of POP with weak trees of wide-leaved species (primarily birch and aspen) was significantly lower.
The share of damaged trees in general for all regions for the analysed period has increased (from 23% in 2008 to 39% in 2010). Primary causes of damage were fungous diseases (20–40%), insects as well as abiotic factors. The share of human-induced factors for all subjects was below 12%. The maximum shares of damaged trees of dominant species in POP (above 80%) for the entire period of observations were found in four regions: Republic of Karelia (predominantly the Karelian Isthmus), Leningrad Region, Murmansk Region and Kaliningrad Region. Kaliningrad Region was the only region where all POP had damaged trees in 2008-2010. Occurrence of the most dangerous causes of tree damage was the highest in Leningrad Region and the Republic of Karelia. Blister rust was widely spread there.
In general, the cartographic analysis of dynamics of tree species condition over 2008-2010 shows Leningrad Region (especially the Karelian Isthmus) where middle taiga forests were steadily characterised by the worst average condition of tree plants within the entire ICP Forests network. This can be related to a combined impact of natural (landscape type, biotic damage) and human-induced factors, in particular, recreational loads and effects of air contaminants. A large number of sick and damaged trees can also be found in near-tundra and north taiga forests in Murmansk Region and the Republic of Karelia. To the highest extent, the damage was manifested in the POP focused on sand glaciolacustrine landscapes and shields and ridges with glacier exposure of high plains. However, in order to find reasons and identify the condition of tree stratum accurately, we need to increase density of the observation network since the current cell size of 32 x 32 km (with annual observations undertaken on the 64 x 64 km network) is insufficient. Indicators like defoliation degree and share of damaged trees were the most informative (sensitive to primary types of impact). Discoloration and condition categories were less variable, which may be related to the higher bias in estimates during fieldwork and features of calculation methodology for average values.
Acknowledgments
Employees of the Federal State Institution Roslesozaschita branch in Saint Petersburg for providing the results of field ground observations in POP under ICP Forests, RAS corresponding member N. V. Lukina (Center for Forest Ecology and Productivity of the RAS) for guidance in researching the matter and comprehensible support, M. P. Shashkova (Institute of Physical, Chemical and Biological Issues of Soil Science of the RAS) for support in developing the ICP Forests monitoring database.
The research methodology was developed in the framework of an official assignment by CEPL RAS for the Development of Methodological Approaches to Remote Monitoring of Resource Potential and Environmental Condition of Forest Ecosystems (No. 0110-2017-0001, АААА-А18-118052400130-7).
REFERENCES
Alekseev A.S., Trejfel’d R.F., Sinkevich A.E. Monitoring lesov Leningradskoj oblasti na osnove regulyarnoj bioindikacionnoj seti probnyh ploshchadej po programme ICP-Forests (Forests monitoring at the Leningrad Region based on a regular bioindication network of sample plots on the ICP-Forests program). Lesobiologicheskie issledovaniya na Severo-Zapade taezhnoj zony Rossii: itogi i perspektivy: materialy nauch. konf., posvyashchennoj 50-letiyu Instituta lesa Karel’skogo nauchnogo centra RAN, Petrozavodsk: KarNC RAN, 2007. pp. 18-29.
Bahmet O.N., Fedorec N.G., Kryshen’ A.M. Issledovaniya po mezhdunarodnoj programme ICP Forests v Karelii (Investigations within the international program ICP-Forests in Karelia). Trudy Karel’skogo nauchnogo centra RAN, No 2, 2011. pp. 133-139.
Ehkologicheskij atlas Rossii (Ecological Atlas of Russia). Moscow: Izd. Geograficheskij f-t MGU im. M.V.Lomonosova, ZAO «Karta», 2002, 128 p.
Eydlina S.P., Knyazeva S.V. Informatsionnoye i kartograficheskoye soprovozhdeniye monitoringa ICP Forests v Rossii (Information and cartographical support of ICP Forests monitoring program in Russia), Geographic information systems and remote sensing. Proceedings of the III International conference, Tsakhkadzor, 2014, pp.36-42.
Filipchuk A.N., Strahov V.V., Teplyakov V.K. Obzor metodov inventarizacii lesov v zarubezhnyh stranah (Overview of forest inventory methods in foreign countries). Moscow: VNIIClesresurs, 1995, 71 p
Gillis M.D., Omule A.Y., and Brierlay T. Monitoring Canada’s forests: The National Forest Inventory. The Forestry Chronicle, 2005, Vol. 81, No 2, pp. 214-221.
Kangas A., Maltamo M. Forest Inventory. Methodology and Applications. Managing Forest Ecosystems. Dordrecht: Springer. 2006. Vol. 10. 363 p
Knyazeva S.V., Eydlina S.P. Organizatsiya prostranstvennykh i atributivnykh baz dannykh v sisteme lesopatalogicheskogo monitoringa po mezhdunarodnoy programme ICP Forests (Organization of spatial and attribute databases in the system of forest pathological monitoring according to the ICP Forests international program), Aerospace methods and geoinformation technologies in forest science and forestry in forestry and forest management. Proceedings of the V All-Russian scientific conference (with the international participation) dedicated to the memory of outstanding forestry scientists V.I. Sukhikh and G.N. Korovin. Moscow.: Centre for forest ecology and productivity RAS, 2013, pp. 282-286.
Knyazeva S.V., Lukina N.V., Eydlina S.P., Orlova M.A., Smirnov V.E., Gornov A.V., Kuznetsov P.V., Zukert N.V. Vozmozhnosti primeneniya metodiki ICP Forests dlya tseley Gosudarstvennoy inventarizatsii lesov kraynego severa (The possibility of using the ICP Forests methodology for the purposes of the State Forest Inventory), Biodiversity of the Far North Ecosystems: inventory, monitoring, protection. Proceedings of the All-Russian scientific conference. Syktyvkar: Institut biologii Komi NC UrO RAN, 2013, pp. 530-533, available at: http://ib.komisc.ru/add/conf/tundra
Lukina N.V., Orlova M.A., Gornov A.V., Kuznetsov P.V., Knyazeva S.V., Smirnov V.E., Zukert N.V., Eydlina S.P., Yershov V.V. Otsenka kriteriyev ustoychivogo upravleniya lesami s ispol’zovaniyem indikatorov mezhdunarodnoy programmy ICP Forests (Assessment of Sustainable Forest Management Criteria using indicators of the ICP Forests international program), Lesovedeniye, 2013, No 5, pp. 62-75.
Metodicheskiye rekomendatsii po monitoringu lesov v sootvetstvii s mezhdunarodnoy programmoy ICP Forests, utverzhdennyye prikazom Rosleskhoza ot 15.07.09 №292 (Methodological guidelines on forest monitoring in accordance with the international program ICP Forests, approved by order of Rosleskhoz from 15.07.09 №292). Otchet CEHPL RAN o NIR po teme “Razrabotka nauchno-obosnovannyh predlozhenij po kriteriyam i indikatoram oslableniya lesov na osnove rezul’tatov lesopatologicheskogo monitoringa, vypolnennogo po mezhdunarodnym standartam, dlya ocenki ispolneniya peredannyh polnomochij v oblasti lesnyh otnoshenij”(Development of scientifically-based proposals for criteria and indicators for forest attenuation based on the results of forest pathological monitoring carried out according to international standards to assess the implementation of transferred powers within forest relations). Part. 1. 212 p. Moscow, 2011.
Otchet CEHPL RAN o NIR po teme “Razrabotka nauchno-obosnovannyh predlozhenij po kriteriyam i indikatoram oslableniya lesov na osnove rezul’tatov lesopatologicheskogo monitoringa, vypolnennogo po mezhdunarodnym standartam, dlya ocenki ispolneniya peredannyh polnomochij v oblasti lesnyh otnoshenij”(Development of scientifically-based proposals for criteria and indicators for forest attenuation based on the results of forest pathological monitoring carried out according to international standards to assess the implementation of transferred powers within forest relations). Part. 1. 172 p. Moscow, 2012.
Powell, D.S., McWilliams, W.H., and Birdsey, R.A. History change and the U.S. Forest Inventory, Journal of Forestry, 1994, Vol. 12. pp.6-11.
Prikaz Rosleskhoza (Order of Federal Forestry Agency organize permanent), No 292, 2009
Shvidenko A.Z. Kakaya sistema ucheta lesov nuzhna Rossii? (Which of forests system accounting does Russia need?). Lesnaya taksaciya i lesoustrojstvo, Krasnoyarsk: SibGTU, 2007, No. 1 (37), pp. 128-156.
Tomppo E. Kangas A., Maltamo M. (eds.). The Finnish National Forest Inventory. Forest Inventory. Methodology and Applications. Managing Forest Ecosystems. Vol. 10. Dordrecht: Springer. pp 179-194.
Tomppo E, Katila M., Mäkisara K., Peräsaari J. The Multi-source National Forest Inventory of Finland – methods and results 2011. Working Papers of the Finnish Forest Research Institute, Measurement. 2011, Vol. 319., pp. 1-224, available at: http://www.metla.fi/julkaisut/workingpapers/2014/mwp319.pdf
Wulder M.A., Kurz W.A., Gillis M.D. National level forest monitoring and modeling in Canada. Progress in Planning. 2003. Vol. 61. pp. 365-381.
Zhirin V.M., Lukina N.V. Razvitiye sistemy inventarizatsii lesov v Rossii (Development of a Forest Inventory System in Russia), Forestry Bulletin, 2017, Vol. 21, No 2. pp. 4-14.
Zhivotovskij L.A. Populyacionnaya biometriya (Population biometrics). Moscow: Nauka, 1991, 271 p.
Reviewer: DSc in biolody, рrofessor Golubeva E.I.